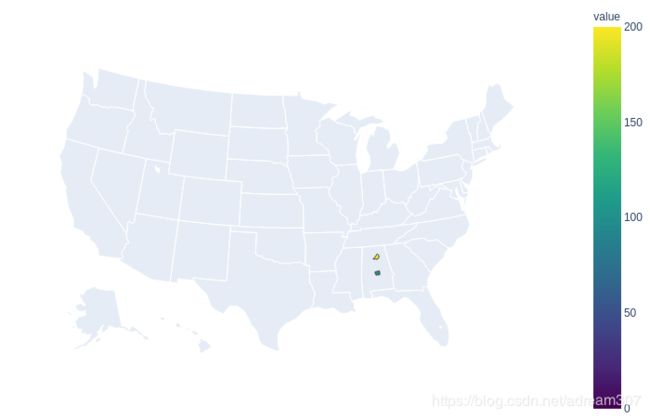
plotly绘制轮廓图
参考代码: plotly
import plotly.express as px

g0={'type': 'Polygon', 'coordinates': [[[-86.496774, 32.344437], [-86.717897, 32.402814], [-86.814912, 32.340803], [-86.890581, 32.502974], [-86.917595, 32.664169], [-86.71339, 32.661732], [-86.714219, 32.705694], [-86.413116, 32.707386], [-86.411172, 32.409937], [-86.496774, 32.344437]]]}
g1={'type': 'Polygon', 'coordinates': [[[-86.577799, 33.765316], [-86.759144, 33.840617], [-86.953664, 33.815297], [-86.954305, 33.844862], [-86.96296, 33.844865], [-86.963358, 33.858221], [-86.924387, 33.909222], [-86.793914, 33.952059], [-86.685365, 34.05914], [-86.692061, 34.092654], [-86.599632, 34.119914], [-86.514881, 34.25437], [-86.45302, 34.259317], [-86.303516, 34.099073], [-86.332723, 33.986109], [-86.370152, 33.93977], [-86.325622, 33.940147], [-86.377532, 33.861706], [-86.577528, 33.801977], [-86.577799, 33.765316]]]}
p0={'id':'g0', 'geometry':g0}
p1={'id':'g1', 'geometry':g1}
polygon={"type":"FeatureCollection", "features":[p0,p1]}
d0={'value':100, 'geo_id':'g0'}
d1={'value':200, 'geo_id':'g1'}
data=[d0,d1]

fig = px.choropleth(data, geojson=polygon, locations='geo_id', color='value',
                           color_continuous_scale="Viridis",
                           range_color=(0, 200),
                           scope="usa",
                           labels={'unemp':'unemployment rate'}
                          )
fig.update_layout(margin={"r":0,"t":0,"l":0,"b":0})
fig.show()
geojson的type必须是FeatureCollection
