pandas列联表crosstab透视图pivot_table总结
pandas.pivot_table 透视表##
pandas.pivot_table(data, values=None, index=None, columns=None, aggfunc=‘mean’, fill_value=None, margins=False, dropna=True)
参数:
- data : DataFrame
- values : column to aggregate, optional
- index : a column, Grouper, array which has the same length as data, or list of them.
Keys to group by on the pivot table index. If an array is passed, it is being used as the same manner as column values. - columns : a column, Grouper, array which has the same length as data, or list of them.
Keys to group by on the pivot table column. If an array is passed, it is being used as the same manner as column values. - aggfunc : function, default numpy.mean, or list of functions
If list of functions passed, the resulting pivot table will have hierarchical columns whose top level are the function names (inferred from the function objects themselves) - fill_value : scalar, default None
Value to replace missing values with - margins : boolean, default False
Add all row / columns (e.g. for subtotal / grand totals) - dropna : boolean, default True
Do not include columns whose entries are all NaN
返回:数据框
例如:
按‘产地’和‘类别’重新索引,然后在‘价格’和‘数量’上执行mean函数
对‘价格’应用‘max’函数,并提供分项统计,缺失值填充0
df1=df.pivot_table('价格',index='产地',columns='类别',aggfunc='max',margins=True,fill_value=0)
print(df1)
pandas.crosstab交叉表
交叉表是用于统计分组频率的特殊透视表
- index : array-like, Series, or list of arrays/Series
Values to group by in the rows - columns : array-like, Series, or list of arrays/Series
Values to group by in the columns - values : array-like, optional
Array of values to aggregate according to the factors - aggfunc : function, optional
If no values array is passed, computes a frequency table - rownames : sequence, default None
If passed, must match number of row arrays passed - colnames : sequence, default None
If passed, must match number of column arrays passed - margins : boolean, default False
Add row/column margins (subtotals) - dropna : boolean, default True
Do not include columns whose entries are all NaN
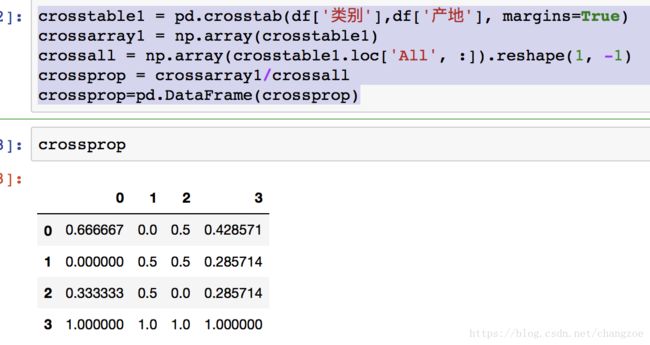
变量类别和产地的交叉表(比例)
crosstable1 = pd.crosstab(df['类别'],df['产地'], margins=True)
crossarray1 = np.array(crosstable1)
crossall = np.array(crosstable1.loc['All', :]).reshape(1, -1)
crossprop = crossarray1/crossall
crossprop=pd.DataFrame(crossprop)
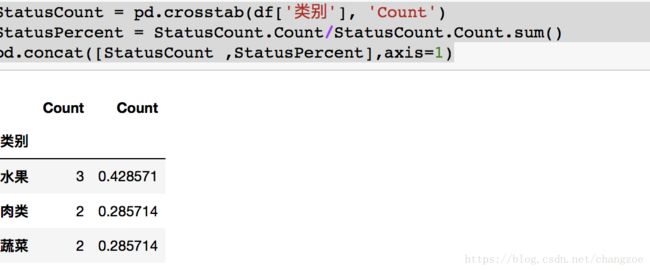
单变量类别的分析
StatusCount = pd.crosstab(df['类别'], 'Count')
StatusPercent = StatusCount.Count/StatusCount.Count.sum()
pd.concat([StatusCount ,StatusPercent],axis=1)
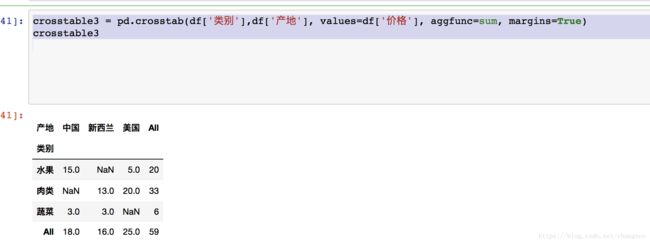
对类别和产地计算价格的和
crosstable3 = pd.crosstab(df['类别'],df['产地'], values=df['价格'], aggfunc=sum, margins=True)
crosstable3
写一个函数–方便我输出我要的格式
def crosstable(df):
    dfnew = df[df['reg_month_type '] == 1] ###定义新的数据集
    risk1=pd.crosstab(df['riskrank '],df['yymm '])
    (m,n)=risk1.shape
    for i in range(n):
        prop = risk1.ix[:,i]/sum(risk1.ix[:,i])
        risk1 = pd.concat([risk1,prop],axis=1)
    monthtab1=pd.crosstab(df['reg_month_type '],df['yymm '])
    (m,n)=monthtab1.shape
    for i in range(n):
        prop = monthtab1.ix[:,i]/sum(monthtab1.ix[:,i])
        monthtab1 = pd.concat([monthtab1,prop],axis=1)
    credit1=pd.crosstab(df['credit_limit_type'],df['yymm '])
    (m,n)=credit1.shape
    for i in range(n):
        prop = credit1.ix[:,i]/sum(credit1.ix[:,i])
        credit1 = pd.concat([credit1,prop],axis=1)
    ####新客户
    risknew1=pd.crosstab(dfnew['riskrank '],dfnew['yymm '])
    (m,n)=risknew1.shape
    for i in range(n):
        prop = risknew1.ix[:,i]/sum(risknew1.ix[:,i])
        risknew1 = pd.concat([risknew1,prop],axis=1)
    monthnew1=pd.crosstab(dfnew['reg_month_type '],dfnew['yymm '])
    (m,n)=monthnew1.shape
    for i in range(n):
        prop = monthnew1.ix[:,i]/sum(monthnew1.ix[:,i])
        monthnew1 = pd.concat([monthnew1,prop],axis=1)
    creditnew1=pd.crosstab(dfnew['credit_limit_type'],dfnew['yymm '])
    (m,n)=creditnew1.shape
    for i in range(n):
        prop = creditnew1.ix[:,i]/sum(creditnew1.ix[:,i])
        creditnew1 = pd.concat([creditnew1,prop],axis=1)
    ####新 全部 并在一起
    risk = pd.concat([risk1,risknew1],axis=1)
    month = pd.concat([monthtab1,monthnew1],axis=1)
    credit = pd.concat([credit1,creditnew1],axis=1)
    #####生成输出的格式
    dftype1=pd.concat([risk,month,credit],axis=0)
    return(dftype1)
stack,unstack
http://pandas.pydata.org/pandas-docs/version/0.17.0/generated/pandas.crosstab.html
pandas文档最好的参考


