【计算机视觉】-图像二值化 - 图像分割 -图像卷积
图像卷积:利用2D卷积核去扫图像,主要是为了实现Blur,高斯滤波本质也是通过卷积来实现的,只不过他的卷积核内参数是符合高斯分布的。
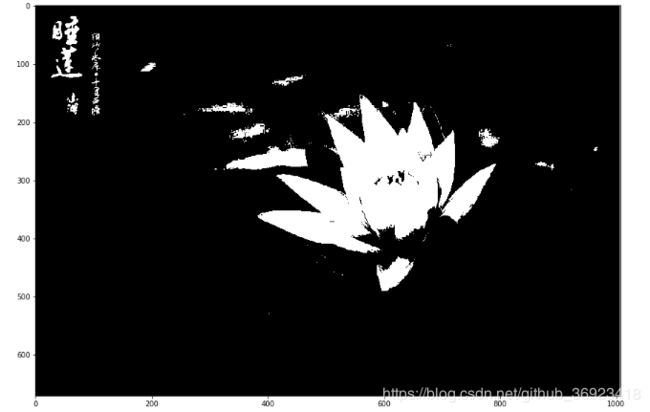
图像二值化:图像二值化之后为黑白图像,相当于mask掩模,用于挖出图像中的非规则感兴趣ROI区域。
图像分割:本文主要说的是传统方法的分割,主要是基于灰度图像的直方图统计,选取阈值,进行分割。
实现:我们会用到的工具有 python ,matplotlib,opencv进行接下来的任务
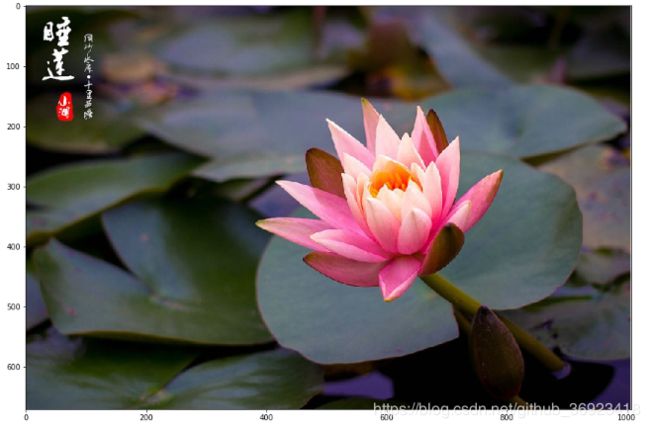
1、读取图像
img=cv2.imread('/mnt/disk2/oujie/107L2ZEWVQFI2($_Z4F{(]D.png')
plt.figure(figsize=(15,10))
plt.imshow(cv2.cvtColor(img.astype(np.uint8), cv2.COLOR_BGR2RGB))
plt.show()
2、原图灰度化并选取ROI区域
img_gray=cv2.cvtColor(img.astype(np.uint8), cv2.COLOR_BGR2GRAY)
img_roi=img_gray[150:520,380:800]

###################显示
plt.figure(figsize=(15,10))
plt.imshow(img_gray, cmap ='gray')
plt.show()

plt.figure(figsize=(15,10))
plt.imshow(img_roi, cmap ='gray')
plt.show()
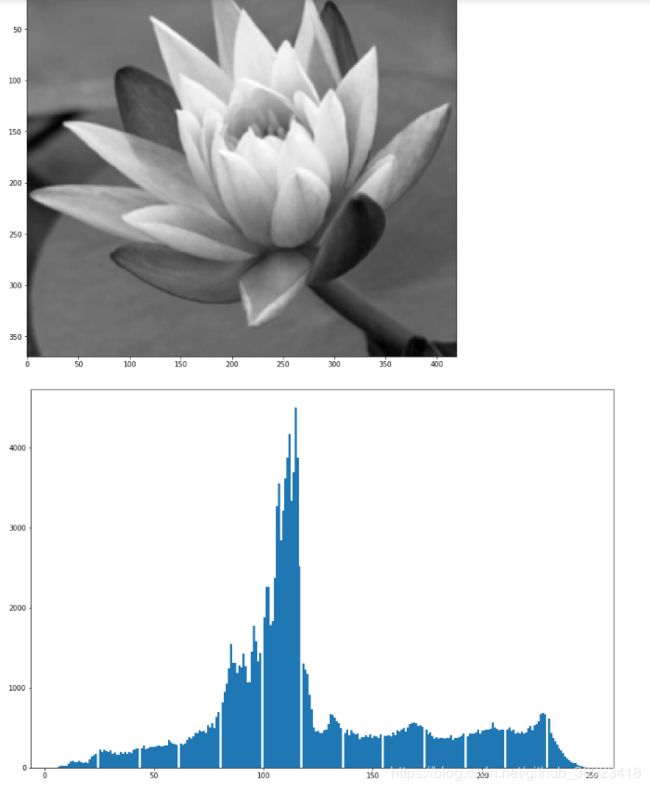
3、利用直方图对ROI区域进行 “响应灰度值”统计,这里主要用numpy的直方图接口
img_roi_blur=cv2.GaussianBlur(img_roi,(5,5),0)
plt.figure(figsize=(15,10))
plt.imshow(img_roi_blur, cmap ='gray')
plt.show()
img_roi_data=img_roi_blur.flatten()#把数据转换成一维的
plt.figure(figsize=(15,10))
n, bins, patches = plt.hist(img_roi_data, bins=255, alpha=1)#为了显示出来用的plt接口
#numpy用法hist1=np.histogram(img_roi_data, bins=255)
plt.show()
4、选取阈值进行二值化,阈值选择主要是该类灰度值,数量多,我们选择120,要是想选择多个条件,可以结合numpy的逻辑运算
img_mask=np.zeros((img_gray.shape))
img_gray_blur=cv2.GaussianBlur(img_gray,(5,5),0)  #滤波可以减少噪声带来的影响
#img_mask[np.where(np.logical_and(img_gray>85,img_gray<120))]=255
img_mask[np.where(img_gray_blur>120)]=255
plt.figure(figsize=(15,10))
plt.imshow(img_mask, cmap ='gray')
plt.show()
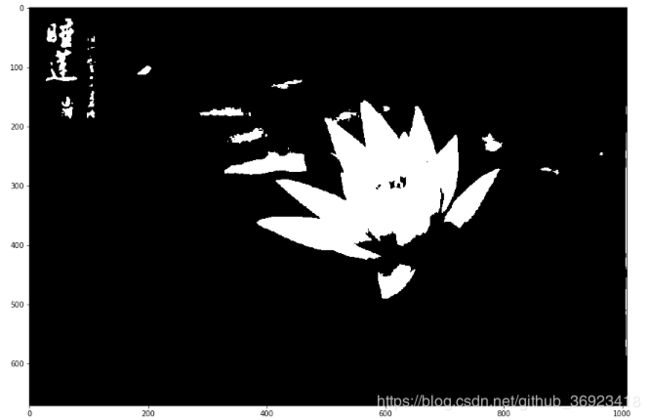
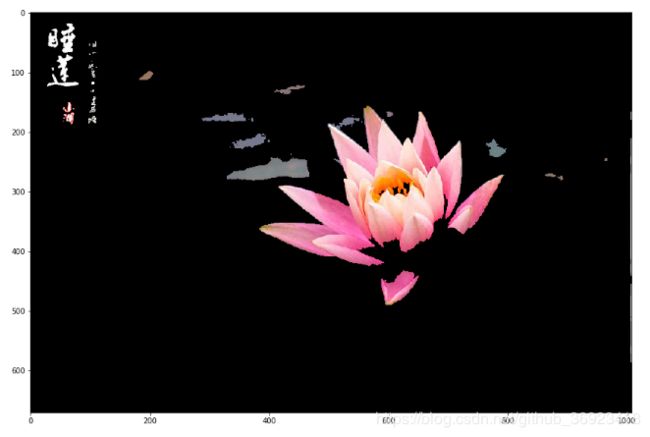
5、利用mask扣出原图
记得一定要把得到的mask进行数据类型转化,uint8,或者支持的其他类型
img_result=cv2.bitwise_and(img,img,mask=img_mask.astype(np.uint8))
plt.figure(figsize=(15,10))
plt.imshow(cv2.cvtColor(img_result, cv2.COLOR_BGR2RGB))
plt.show()
6、二值化部分也可以用别的办法进行,比如动态阈值(大津法OTSU)
