2018年QQ群聊天记录分析及可视化——时间线
前言
这个小demo是为了练手,把2018年我和我五个好朋友的群聊天记录进行分析挖掘,以及可视化。
python3.6
pandas
numpy
pyecharts
预处理:
首先从QQ消息管理器里导出聊天记录:
2019-01-12 20:04:30 秋非凡(100****042)
没定级赛啊
可以看出构成成份是
yyyy-mm-dd hh:mm:ss username(userid)\ntext
所以把txt规范为csv文件:
| 属性 | 解释 |
|---|---|
| year | 年 |
| month | 月 |
| day | 日 |
| hour | 时 |
| minute | 分 |
| second | 秒 |
| userid | 昵称(脱敏把真实QQ号隐藏了) |
| text | 聊天文本 |
从QQ导出的聊天记录的时间是2018-01-01 11:47:04格式的
手贱就把他分成这样的了:
| year | mon | day | hour | min | sec | userid | text |
|---|---|---|---|---|---|---|---|
| 2018 | 1 | 1 | 11 | 47 | 4 | 大头 | 擦 |
于是又另起三列(df[“xxx”] = xxx的赋值方式是在dataframe最右边添加列)
df["date"]  = pd.PeriodIndex(year=df["year"], month=df["month"], day=df["day"], freq="D")

df["time"] = df["hour"].astype("str").str.cat(df["minute"].astype("str"),sep=":").str.cat(df["second"].astype("str"),sep=":")

df["datetime"] = df["date"].astype("str").str.cat(df["time"].astype("str"),sep=" ")
变成
| year | month | day | hour | minute | second | userid | text | date | time | datetime |
|---|---|---|---|---|---|---|---|---|---|---|
| 2018 | 1 | 1 | 11 | 47 | 4 | 大头 | 擦 | 2018-01-01 | 11:47:4 | 2018-01-01 11:47:4 |
参考:
Pandas详解七之DatetimeIndex、PeriodIndex和TimedeltaIndex时间序列
pandas的多列拼接成一列函数
时间
人发言次数和发图占比
在jupyter环境下:获取发言次数和发图次数
df.groupby("userid")["text"].size()#获取发言次数
df[df["text"] == "[图片]"].groupby("userid").size()#获取发图次数
然后绘图:
from pyecharts import options as opts
from pyecharts.charts import Bar,Line,Grid
from pyecharts.globals import ThemeType
userid_list = ['栓二',"二大爷",'摇摆', '大头', '秋豪', '蓝鸡']
pic_num_list = [1264,2793,1810,3823,4660,7314]
word_num_list = sorted([14290, 18716, 14456, 10417, 25606, 38361])
bar = (
        Bar(init_opts=opts.InitOpts(theme=ThemeType.LIGHT))
        .add_xaxis(userid_list)
        .add_yaxis("发图次数",pic_num_list,stack = "1")
        .add_yaxis("发言次数",list(map(lambda x: x[0]-x[1], zip(word_num_list,pic_num_list))),stack = "1")
        .reversal_axis()#坐标翻转
        .set_global_opts(
            title_opts=opts.TitleOpts(title="Bar-发言次数和发图占比"),
            legend_opts=opts.LegendOpts(pos_top="80%",pos_right = "10%"),
        )
        .set_series_opts(
            label_opts=opts.LabelOpts(position = "inside",color = "white")
        )
)
bar.render("bar_user.html")
bar.render_notebook()
month
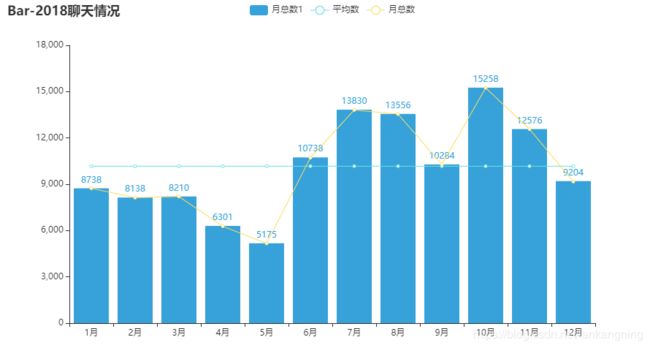
总览2018年聊天情况:
from pyecharts import options as opts
from pyecharts.charts import Bar,Line,Grid
from pyecharts.globals import ThemeType
#数据准备
bar_data = df.groupby(['userid','month']).size()
x_data = ["{}月".format(i) for i in range(1, 13)]
y_data_yb = bar_data['摇摆']
y_data_dt = bar_data['大头']
y_data_lj = bar_data['蓝鸡']
y_data_qh = bar_data['秋豪']
y_data_se = bar_data['栓二']
y_data_edy = bar_data['二大爷']
#绘图
bar = (
    Bar(init_opts=opts.InitOpts(theme=ThemeType.LIGHT))
    .add_xaxis(x_data)
    # 系列数据yaxis_data: Sequence[Numeric, opts.BarItem, dict],这里我们用dict

    .add_yaxis("月总数1",list(df.groupby('month')['text'].size()),color = "blue")
    .set_global_opts(
        title_opts=opts.TitleOpts(title="Bar-2018聊天情况")
        #legend_opts=opts.LegendOpts(pos_top="48%"),
    )
    .set_series_opts(
        label_opts=opts.LabelOpts(position = "top"),
    )
)
line = (
    Line()
    .add_xaxis(x_data)
    .add_yaxis("平均数", [int(df["text"].count()/12)]*12)
    .add_yaxis("月总数",list(y_data_yb+y_data_dt+y_data_lj+y_data_qh+y_data_se+y_data_edy))
    .set_series_opts(
        label_opts=opts.LabelOpts(is_show=False),
    )
)
bar.overlap(line)#line覆盖在bar上
bar.render("bar_month.html")
bar.render_notebook()

可以看到下半年明显比上半年多,估计是大三下半年都没什么事闲了(但是我不是应该在考研么
十月是巅峰,平均数达到了10167条发言/月
week:
df.groupby("week")["text"].count().index#x轴
df.groupby("dayofweek")["text"].count()#y轴
from pyecharts import options as opts
from pyecharts.charts import Bar


def bar_base() -> Bar:
    c = (
        Bar(init_opts=opts.InitOpts(theme=ThemeType.LIGHT))
        .add_xaxis(['Sunday','Monday','Tuesday', 'Wednesday', 'Thursday','Friday', 'Saturday'])
        .add_yaxis("", [19574,15819,14125,13825,20841,17272,20552])
        .set_global_opts(title_opts=opts.TitleOpts(title="Bar-星期聊天情况"))
    )
    return c
bar_base().render("bar-week.html")
bar_base().render_notebook()
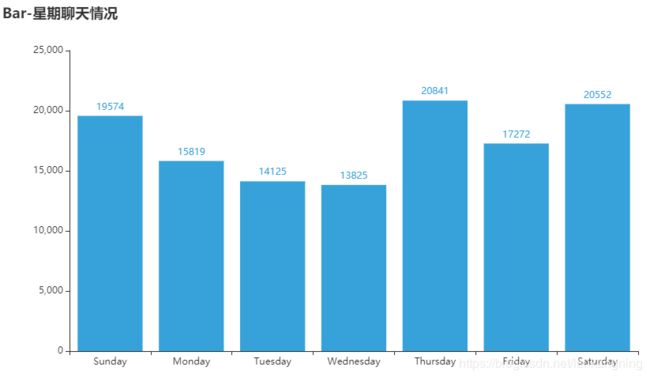
| Monday | Tuesday | Wednesday | Thursday | Friday | Saturday | Sunday |
|---|---|---|---|---|---|---|
| 15819 | 14125 | 13825 | 20841 | 17272 | 20552 | 19574 |
热衷于在星期4聊天
day
#ebedf0
#c6e48b
#7bc96f
#239a3b
#196127
import datetime
from pyecharts import options as opts
from pyecharts.charts import Calendar

def calendar_base() -> Calendar:
    #起止时间
    begin = datetime.date(2018, 1, 1)
    end = datetime.date(2018, 12, 31)
    #颜色和数据
    calendar_color=["#ebedf0","#c6e48b","#7bc96f","#239a3b","#196127"]
    calendar_data = [
        [df.groupby("date").size().index[i],list(df.groupby("date").size())[i]]
                  for i in range(len(df.groupby("date").size()))
    ]
    data = daily_data

    c = (
        Calendar(init_opts = opts.InitOpts(width = "1200px",height = "500px"))
        .add("", data, calendar_opts=opts.CalendarOpts(range_=[begin,end]))
        #全局配置项
        .set_global_opts(
            #画幅配置,必须大,不然显示不全
            #init_opts = opts.InitOpts(),
            #标题配置
            title_opts=opts.TitleOpts(title="Calendar-2018年聊天记录情况"),
            #视觉映射配置
            visualmap_opts=opts.VisualMapOpts(
                max_=1200,
                min_=0,
                orient="horizontal",
                pos_top="middle",
                pos_left="center",
                is_piecewise=True,
                pieces = [
                              {"min": 1000,"color":color[4]},
                              {"min": 600, "max": 1000,"color":color[3]},
                              {"min": 300, "max": 600,"color":color[2]},
                              {"min": 100, "max": 300,"color":color[1]},
                              {"max": 100,"color":color[0]}
                         ]

            ),
        )
    )
    return c
c.render("calendar.png")
c.render("calendar.html")
c.render_notebook()
聊的最多的一天,2018-07-08,1522条消息=253条/人=3篇高考作文/人
hour
from pyecharts import options as opts
from pyecharts.charts import Bar

hour_data_list = list(df.groupby("hour")["text"].size())#获取每个小时段的聊天记录数量
hour_data_list.insert(5,0)#凌晨5点无记录

def bar_base() -> Bar:
    c = (
        Bar()
        .add_xaxis([i for i in range(24)])
        .add_yaxis("", hour_data_list)
        .set_global_opts(title_opts=opts.TitleOpts(title="Bar-时段聊天情况"))
    )
    return c
bar_base().render("bar-hour.html")
bar_base().render_notebook()

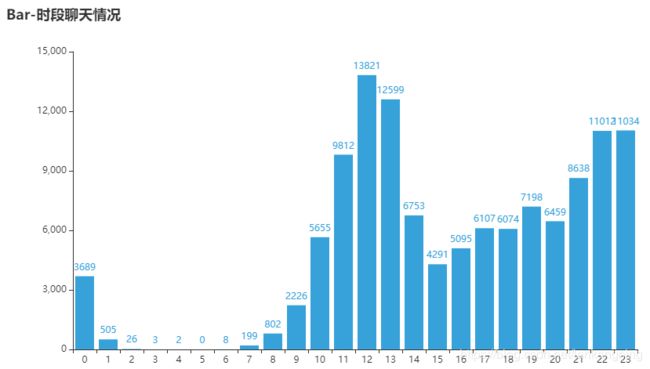
热衷于中午11-13点;晚上21-23点聊天(饭点睡点吹牛逼嗷
#我是今夜熬到最晚的王#
2018-08-02 02:03:05 在DNF下线后,蓝鸡和摇摆哥讨论海豹打团微信小程序
2018-12-05 02:27:09 二大爷因为没电放弃了肖秀荣视频的下载并说了句“吔屎啦!梁非凡!”
2018-09-07 02:41:44 摇摆哥在肚皮痛醒了之后喝了一杯热水睡下并说了句“nice”
2018-12-03 03:28:33 二大爷丝毫不接上下文,发了张图片
2018-12-07 03:47:50 二大爷丝毫不接上下文,又发了张图片
2018-07-07 03:59:09 估计失眠,蓝鸡发了句“哭了”
2018-02-12 04:58:36 二大爷因为头疼醒来


