03_行销(Marketing)里用决策树来做转换率 (Conversion Rate)预测
行销(Marketing)里用决策树来做转换率 (Conversion Rate)预测
- Load the packages
- Load the data
- Data Analysis
- Encoding Categorical Variables
- Fitting Decision Trees
- Interpreting Decision Tree Model
我们在01_行销(Marketing)里的有用的KPI-转换率 (Conversion Rate) 文章中介绍了什么是转换率。在这篇里我还是用银行的数据来演示怎么用决策树来做转换率预测。从而可以帮我们很好地看看到底哪些因素导致了顾客的转换。逻辑回归模型通过找到最佳估计事件发生对数几率的特征变量的线性组合来从数据中学习。顾名思义,决策树是通过生长一棵树来从数据中学习的。在下一节中,我们将讨论决策树模型如何增长以及如何构建树,但是逻辑回归和决策树模型之间的主要区别在于,逻辑回归算法会在决策树中搜索单个最佳线性边界。特征集,而决策树算法则对数据进行分区,以查找发生事件的可能性很高的数据子组。
对于决策树,我们一般有两个指标来做树的分枝。基尼杂质 (Gini impurity)和熵信息增益 (Entropy information gain)。简而言之,Gini杂质测量的是分区的不纯,熵信息增益的测量是通过使用测试的标准将数据分割得到的信息量。


在这篇里,我会继续用Kaggle的数据来演示怎么用决策树做预测分类模型。数据来源于 bank-full.csv。
# This Python 3 environment comes with many helpful analytics libraries installed
# It is defined by the kaggle/python Docker image: https://github.com/kaggle/docker-python
# For example, here's several helpful packages to load

import numpy as np # linear algebra
import pandas as pd # data processing, CSV file I/O (e.g. pd.read_csv)

# Input data files are available in the read-only "../input/" directory
# For example, running this (by clicking run or pressing Shift+Enter) will list all files under the input directory

import os
for dirname, _, filenames in os.walk('/kaggle/input'):
    for filename in filenames:
        print(os.path.join(dirname, filename))

# You can write up to 5GB to the current directory (/kaggle/working/) that gets preserved as output when you create a version using "Save & Run All"
# You can also write temporary files to /kaggle/temp/, but they won't be saved outside of the current session
/kaggle/input/bank-marketing-dataset/bank-full.csv
Load the packages
import matplotlib.pyplot as plt
import pandas as pd
from sklearn import tree
import graphviz
%matplotlib inline
Load the data
df = pd.read_csv('../input/bank-marketing-dataset/bank-full.csv', sep=",")
df.head(3)
| age | job | marital | education | default | balance | housing | loan | contact | day | month | duration | campaign | pdays | previous | poutcome | y | |
|---|---|---|---|---|---|---|---|---|---|---|---|---|---|---|---|---|---|
| 0 | 58 | management | married | tertiary | no | 2143 | yes | no | unknown | 5 | may | 261 | 1 | -1 | 0 | unknown | no |
| 1 | 44 | technician | single | secondary | no | 29 | yes | no | unknown | 5 | may | 151 | 1 | -1 | 0 | unknown | no |
| 2 | 33 | entrepreneur | married | secondary | no | 2 | yes | yes | unknown | 5 | may | 76 | 1 | -1 | 0 | unknown | no |
df['conversion'] = df['y'].apply(lambda x: 0 if x == 'no' else 1)
Data Analysis
Conversion Rate
conversion_rate_df = pd.DataFrame(
    df.groupby('conversion').count()['y'] / df.shape[0] * 100.0
)
conversion_rate_df.T
| conversion | 0 | 1 |
|---|---|---|
| y | 88.30152 | 11.69848 |
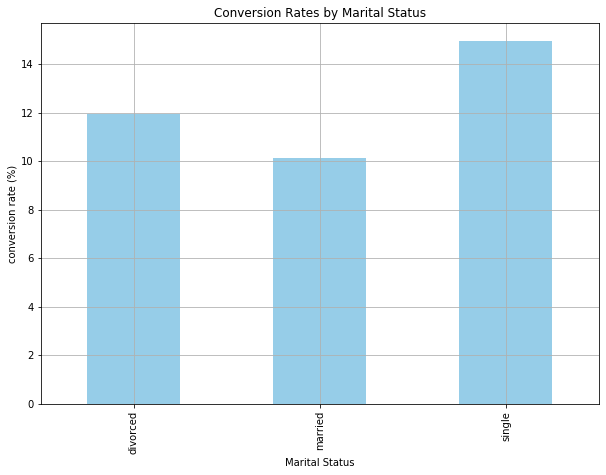
Conversion Rates by Marital Status
conversion_rate_by_marital = df.groupby(
    by='marital'
)['conversion'].sum() / df.groupby(
    by='marital'
)['conversion'].count() * 100.0
conversion_rate_by_marital
marital
divorced    11.945458
married     10.123466
single      14.949179
Name: conversion, dtype: float64
ax = conversion_rate_by_marital.plot(
    kind='bar',
    color='skyblue',
    grid=True,
    figsize=(10, 7),
    title='Conversion Rates by Marital Status'
)

ax.set_xlabel('Marital Status')
ax.set_ylabel('conversion rate (%)')

plt.show()
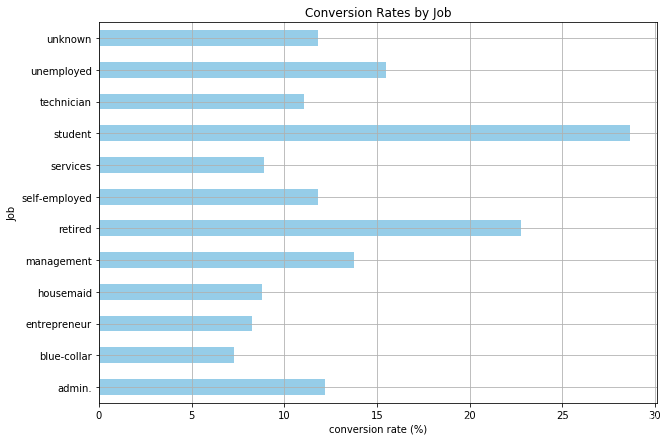
Conversion Rates by Job
conversion_rate_by_job = df.groupby(
    by='job'
)['conversion'].sum() / df.groupby(
    by='job'
)['conversion'].count() * 100.0
conversion_rate_by_job
job
admin.           12.202669
blue-collar       7.274969
entrepreneur      8.271688
housemaid         8.790323
management       13.755551
retired          22.791519
self-employed    11.842939
services          8.883004
student          28.678038
technician       11.056996
unemployed       15.502686
unknown          11.805556
Name: conversion, dtype: float64
ax = conversion_rate_by_job.plot(
    kind='barh',
    color='skyblue',
    grid=True,
    figsize=(10, 7),
    title='Conversion Rates by Job'
)

ax.set_xlabel('conversion rate (%)')
ax.set_ylabel('Job')

plt.show()
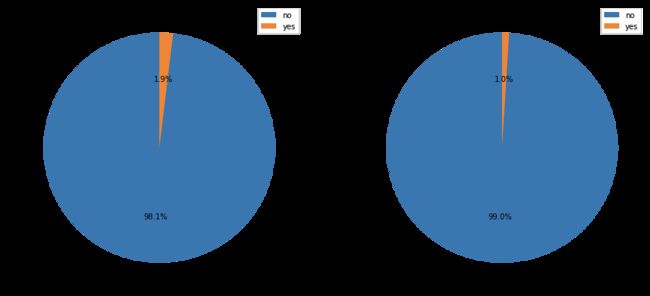
Default Rates by Conversions
default_by_conversion_df = pd.pivot_table(
    df,
    values='y',
    index='default',
    columns='conversion',
    aggfunc=len
)
default_by_conversion_df.columns = ['non_conversions', 'conversions']
default_by_conversion_df
| non_conversions | conversions | |
|---|---|---|
| default | ||
| no | 39159 | 5237 |
| yes | 763 | 52 |
default_by_conversion_df.plot(
    kind='pie',
    figsize=(15, 7),
    startangle=90,
    subplots=True,
    autopct=lambda x: '%0.1f%%' % x
)

plt.show()
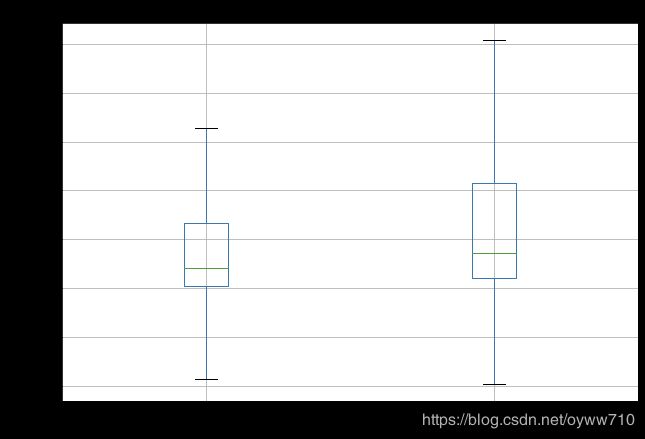
Bank Balance by Conversions
ax = df[['conversion', 'balance']].boxplot(
    by='conversion',
    showfliers=False,
    figsize=(10, 7)
)

ax.set_xlabel('Conversion')
ax.set_ylabel('Average Bank Balance')
ax.set_title('Average Bank Balance Distributions by Conversion')

plt.suptitle("")
plt.show()
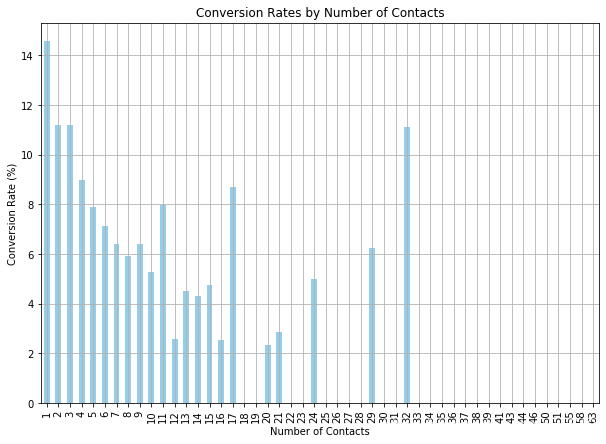
Conversions by Number of Contacts
conversions_by_num_contacts = df.groupby(
    by='campaign'
)['conversion'].sum() / df.groupby(
    by='campaign'
)['conversion'].count() * 100.0
pd.DataFrame(conversions_by_num_contacts).head()
| conversion | |
|---|---|
| campaign | |
| 1 | 14.597583 |
| 2 | 11.203519 |
| 3 | 11.193624 |
| 4 | 9.000568 |
| 5 | 7.879819 |
ax = conversions_by_num_contacts.plot(
    kind='bar',
    figsize=(10, 7),
    title='Conversion Rates by Number of Contacts',
    grid=True,
    color='skyblue'
)

ax.set_xlabel('Number of Contacts')
ax.set_ylabel('Conversion Rate (%)')

plt.show()
Encoding Categorical Variables
categorical_vars = [
    'job',
    'marital',
    'education',
    'default',
    'housing',
    'loan',
    'contact',
    'month'
]
df[categorical_vars].nunique()
job          12
marital       3
education     4
default       2
housing       2
loan          2
contact       3
month        12
dtype: int64
encoding 'month???
df['month'].unique()
array(['may', 'jun', 'jul', 'aug', 'oct', 'nov', 'dec', 'jan', 'feb',
       'mar', 'apr', 'sep'], dtype=object)
months = ['jan', 'feb', 'mar', 'apr', 'may', 'jun', 'jul', 'aug', 'sep', 'oct', 'nov', 'dec']

df['month'] = df['month'].apply(
    lambda x: months.index(x)+1
)
df['month'].unique()
array([ 5, 6, 7, 8, 10, 11, 12, 1, 2, 3, 4, 9])
df.groupby('month').count()['conversion']
month
1      1403
2      2649
3       477
4      2932
5     13766
6      5341
7      6895
8      6247
9       579
10      738
11     3970
12      214
Name: conversion, dtype: int64
encoding 'job’
df['job'].unique()
array(['management', 'technician', 'entrepreneur', 'blue-collar',
       'unknown', 'retired', 'admin.', 'services', 'self-employed',
       'unemployed', 'housemaid', 'student'], dtype=object)
jobs_encoded_df = pd.get_dummies(df['job'])
jobs_encoded_df.head(3)
| admin. | blue-collar | entrepreneur | housemaid | management | retired | self-employed | services | student | technician | unemployed | unknown | |
|---|---|---|---|---|---|---|---|---|---|---|---|---|
| 0 | 0 | 0 | 0 | 0 | 1 | 0 | 0 | 0 | 0 | 0 | 0 | 0 |
| 1 | 0 | 0 | 0 | 0 | 0 | 0 | 0 | 0 | 0 | 1 | 0 | 0 |
| 2 | 0 | 0 | 1 | 0 | 0 | 0 | 0 | 0 | 0 | 0 | 0 | 0 |
jobs_encoded_df.columns = ['job_%s' % x for x in jobs_encoded_df.columns]
jobs_encoded_df.head()
| job_admin. | job_blue-collar | job_entrepreneur | job_housemaid | job_management | job_retired | job_self-employed | job_services | job_student | job_technician | job_unemployed | job_unknown | |
|---|---|---|---|---|---|---|---|---|---|---|---|---|
| 0 | 0 | 0 | 0 | 0 | 1 | 0 | 0 | 0 | 0 | 0 | 0 | 0 |
| 1 | 0 | 0 | 0 | 0 | 0 | 0 | 0 | 0 | 0 | 1 | 0 | 0 |
| 2 | 0 | 0 | 1 | 0 | 0 | 0 | 0 | 0 | 0 | 0 | 0 | 0 |
| 3 | 0 | 1 | 0 | 0 | 0 | 0 | 0 | 0 | 0 | 0 | 0 | 0 |
| 4 | 0 | 0 | 0 | 0 | 0 | 0 | 0 | 0 | 0 | 0 | 0 | 1 |
df = pd.concat([df, jobs_encoded_df], axis=1)
df.head()
| age | job | marital | education | default | balance | housing | loan | contact | day | ... | job_entrepreneur | job_housemaid | job_management | job_retired | job_self-employed | job_services | job_student | job_technician | job_unemployed | job_unknown | |
|---|---|---|---|---|---|---|---|---|---|---|---|---|---|---|---|---|---|---|---|---|---|
| 0 | 58 | management | married | tertiary | no | 2143 | yes | no | unknown | 5 | ... | 0 | 0 | 1 | 0 | 0 | 0 | 0 | 0 | 0 | 0 |
| 1 | 44 | technician | single | secondary | no | 29 | yes | no | unknown | 5 | ... | 0 | 0 | 0 | 0 | 0 | 0 | 0 | 1 | 0 | 0 |
| 2 | 33 | entrepreneur | married | secondary | no | 2 | yes | yes | unknown | 5 | ... | 1 | 0 | 0 | 0 | 0 | 0 | 0 | 0 | 0 | 0 |
| 3 | 47 | blue-collar | married | unknown | no | 1506 | yes | no | unknown | 5 | ... | 0 | 0 | 0 | 0 | 0 | 0 | 0 | 0 | 0 | 0 |
| 4 | 33 | unknown | single | unknown | no | 1 | no | no | unknown | 5 | ... | 0 | 0 | 0 | 0 | 0 | 0 | 0 | 0 | 0 | 1 |
5 rows ?? 30 columns
encoding 'marital’
marital_encoded_df = pd.get_dummies(df['marital'])
marital_encoded_df.columns = ['marital_%s' % x for x in marital_encoded_df.columns]
df = pd.concat([df, marital_encoded_df], axis=1)
df.head()
| age | job | marital | education | default | balance | housing | loan | contact | day | ... | job_retired | job_self-employed | job_services | job_student | job_technician | job_unemployed | job_unknown | marital_divorced | marital_married | marital_single | |
|---|---|---|---|---|---|---|---|---|---|---|---|---|---|---|---|---|---|---|---|---|---|
| 0 | 58 | management | married | tertiary | no | 2143 | yes | no | unknown | 5 | ... | 0 | 0 | 0 | 0 | 0 | 0 | 0 | 0 | 1 | 0 |
| 1 | 44 | technician | single | secondary | no | 29 | yes | no | unknown | 5 | ... | 0 | 0 | 0 | 0 | 1 | 0 | 0 | 0 | 0 | 1 |
| 2 | 33 | entrepreneur | married | secondary | no | 2 | yes | yes | unknown | 5 | ... | 0 | 0 | 0 | 0 | 0 | 0 | 0 | 0 | 1 | 0 |
| 3 | 47 | blue-collar | married | unknown | no | 1506 | yes | no | unknown | 5 | ... | 0 | 0 | 0 | 0 | 0 | 0 | 0 | 0 | 1 | 0 |
| 4 | 33 | unknown | single | unknown | no | 1 | no | no | unknown | 5 | ... | 0 | 0 | 0 | 0 | 0 | 0 | 1 | 0 | 0 | 1 |
5 rows ?? 33 columns
encoding 'housing???
df['housing'].unique()
df['housing'] = df['housing'].apply(lambda x: 1 if x == 'yes' else 0)
encoding 'loan???
df['loan'].unique()
df['loan'] = df['loan'].apply(lambda x: 1 if x == 'yes' else 0)
Fitting Decision Trees
features = [
    'age',
    'balance',
    'campaign',
    'previous',
    'housing',
] + list(jobs_encoded_df.columns) + list(marital_encoded_df.columns)

response_var = 'conversion'
features
['age',
 'balance',
 'campaign',
 'previous',
 'housing',
 'job_admin.',
 'job_blue-collar',
 'job_entrepreneur',
 'job_housemaid',
 'job_management',
 'job_retired',
 'job_self-employed',
 'job_services',
 'job_student',
 'job_technician',
 'job_unemployed',
 'job_unknown',
 'marital_divorced',
 'marital_married',
 'marital_single']
dt_model = tree.DecisionTreeClassifier(
    max_depth=4
)
dt_model.fit(df[features], df[response_var])
DecisionTreeClassifier(ccp_alpha=0.0, class_weight=None, criterion='gini',
                       max_depth=4, max_features=None, max_leaf_nodes=None,
                       min_impurity_decrease=0.0, min_impurity_split=None,
                       min_samples_leaf=1, min_samples_split=2,
                       min_weight_fraction_leaf=0.0, presort='deprecated',
                       random_state=None, splitter='best')
Interpreting Decision Tree Model
dot_data = tree.export_graphviz(
    dt_model,
    out_file=None,
    feature_names=features,
    class_names=['0', '1'],
    filled=True,
    rounded=True,
    special_characters=True
)
graph = graphviz.Source(dot_data)
from IPython.core.display import display, HTML
display(HTML(""))
graph
