R语言绘图(5)-ggplot2学习笔记添加文本注释text,label
geom_text()
geom_text(
mapping = NULL,
data = NULL,
stat = “identity”,
position = “identity”,
…,
parse = FALSE,
nudge_x = 0,
nudge_y = 0,
check_overlap = FALSE,
hjust=‘center’,
vjust=‘center’
angel=0
size=4
na.rm = FALSE,
show.legend = NA,
inherit.aes = TRUE)
mapping = NULL,
data = NULL,
如果在前面有对应的ggplot(data,aes(x,y)),那么geom_text(mapping,data)则继承该参数,否则需用户自己提供指定。
stat = “identity”,
该图层数据的统计变换,为字符串
position
位置调整,字符串
nudge_x = 0,
nudge_y = 0,
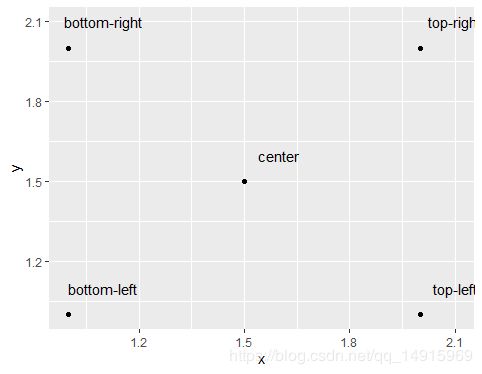
水平或者垂直调整text与数据点的距离,避免遮挡
ggplot(df, aes(x, y)) +geom_point()+geom_text(aes(label = text),nudge_x=0,nudge_y=0)

ggplot(df, aes(x, y)) +geom_point()+geom_text(aes(label = text),nudge_x=0.1,nudge_y=0.1)
check_overlap = FALSE 是否要覆盖同一图层中之前的text注释,多指数据点较多,文本之间重叠严重时
position text文本位置信息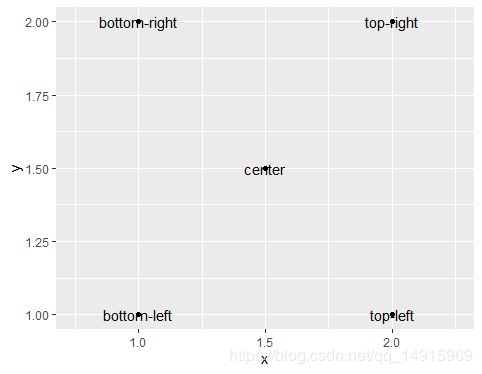
ggplot(df, aes(x, y)) +geom_point()+geom_text(aes(label = text),position=position_dodge(width=0.5))
vjust,hjust
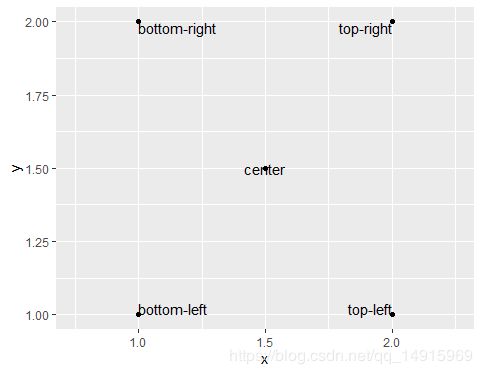
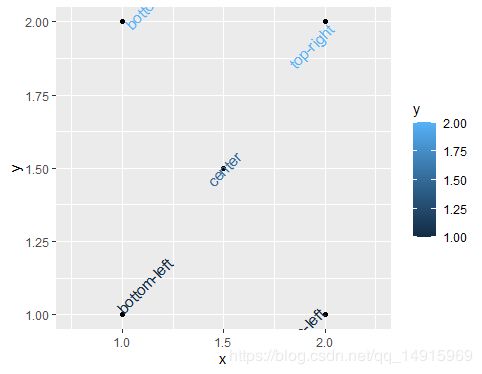
text一般默认文本对齐方式为‘center’居中对齐,可以通过hjust和vjust方法调整文字对齐方式
ggplot(df, aes(x, y)) +geom_point()+geom_text(aes(label = text),position=position_dodge(width=0.5),vjust='inward',hjust='inward')
'inward’表示居中对齐
ggplot(df, aes(x, y)) +geom_point()+geom_text(aes(label = text,color=y),position=position_dodge(width=0.5),vjust='inward',hjust='inward',angle=45,size=4)
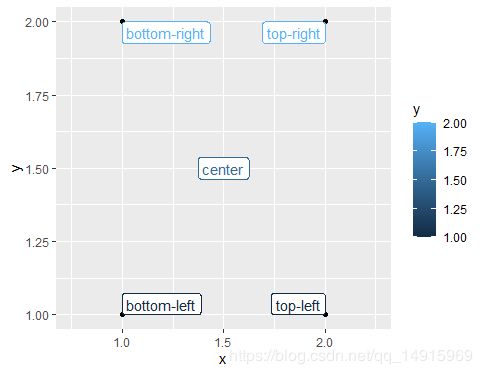
geom_label()
ggplot(df, aes(x, y)) +geom_point()+geom_label(aes(label = text,color=y),position=position_dodge(width=0.5),vjust='inward',hjust='inward',angle=45,size=4)
