vue高德多条路线规划+带途径节点多组多个maker text标签创建+各路线颜色区别
一、
引用准备
高德后台应用申请-web端
index.html 调用版本 v=1.4.2
build-webpack.base.conf.js 配置
  externals: {
    'AMap': 'window.AMap',
    'AMapUI': 'AMapUI'
  }
二、
页面引用 ,我这用的是 vue
import AMap from 'AMap'模拟数据
 mockData: [
          { name: '城配线路1',
            path: [
              { name: '城配a', lnglat: [116.303843, 39.983412] },
              { name: '城配b', lnglat: [116.404844, 39.725628] },
              { name: '城配c', lnglat: [116.615263, 40.029946] },
              { name: '城配d', lnglat: [116.947962, 39.881722] }
            ]
          },
          { name: '城配线路2',
            path: [
              { name: '城配a', lnglat: [116.303843, 39.983412] },
              { name: '城配e', lnglat: [116.197874, 39.715861] },
              { name: '城配f', lnglat: [116.219721, 39.849823] },
              { name: '城配g', lnglat: [116.987962, 39.811722] }
            ]
          },
          { name: '城配线路3',
            path: [
              { name: '城配a', lnglat: [116.303843, 39.983412] },
              { name: '城配x', lnglat: [116.292874, 39.813861] },
              { name: '城配y', lnglat: [116.612721, 39.839823] },
              { name: '城配z', lnglat: [116.927962, 39.861722] }
            ]
          }
        ]
使用页面预置,本想做成 根据 模拟数据长度 自动生成对应数目 panel*-div 然后appendchild插入的,但是失败了。
        修改
        重置
核心使用 initMap()
initMap(lineData) {
        console.log('initMap2')
        // const _this = this
        const mapObj = new AMap.Map('mapAmap2', {
          center: [116.397559, 39.89621],
          zoom: 1
        })
        const colors = ['#DC143C', '#5F9EA0', '#00BFFF', '#C71585', '#6495ED',
          '#008B8B', '#FFFF00', '#FFD700', '#FFDEAD', '#FF4500',
          '#FF8C00', '#8B4513', '#FFF5EE', '#FF7F50', '#FF6347']
        // let Driving_obj = {}
        let routeLine_obj = {}
        let Driving_obj = new AMap.Driving({
          map: mapObj, // map 指定将路线规划方案绘制到对应的AMap.Map对象上
          // panel: 'panel0' // panel 指定将结构化的路线详情数据显示的对应的DOM上,传入值需是DOM的ID
        })
        console.log('lineData[0].path', lineData[0].path)
        for (let f = 0; f < lineData.length; f++) {
          // Driving_obj = new AMap.Driving({
          //   // map: mapObj, // map 指定将路线规划方案绘制到对应的AMap.Map对象上
          //   panel: 'panel' + f // panel 指定将结构化的路线详情数据显示的对应的DOM上,传入值需是DOM的ID
          // })
          const item_path = lineData[f].path
          const now_length = item_path.length
          const item_start_path = item_path[0]
          const item_end_path = item_path[now_length - 1]
          const now_arr = item_path.slice(1, now_length - 1)
          // console.log('now_arr', now_arr)
          const item_way_path = []
          now_arr.map(item => item_way_path.push(new AMap.LngLat(item.lnglat[0], item.lnglat[1])))
          Driving_obj.search(
            new AMap.LngLat(item_start_path.lnglat[0], item_start_path.lnglat[1]),
            new AMap.LngLat(item_end_path.lnglat[0], item_end_path.lnglat[1]),
            { waypoints: item_way_path },
            function(status, result) {
              //  searchResult即是对应的驾车导航信息,相关数据结构文档请参考  https://lbs.amap.com/api/javascript-api/reference/route-search#m_DrivingResult
              if (status === 'complete') {
                console.log('获取货车规划数据成功')
                if (result.routes && result.routes.length) {
                  const cc = drawRoute(result.routes[0], f)
                  const cc2 = createMarker(lineData[f].name, now_arr)
                  // 设置 marker-text 集合
                  const setFitViewArrs = cc.concat(cc2)
                  // 调整视野达到最佳显示区域
                  mapObj.setFitView(setFitViewArrs)
                }
              } else {
                console.log('获取货车规划数据失败:' + result)
              }
            })
        }

        // 途径节点 marker 集合- 此处用了 new AMap.Text 需 版本1.4.2
        function createMarker(lineName, now_arr) {
          let d = {}
          const middleMarkers = []
          for (let f = 0; f < now_arr.length; f++) {
            d = new AMap.Text({
              text: lineName + '-' + (f + 1) + '号节点:' + now_arr[f].name,
              position: now_arr[f].lnglat,
              map: mapObj
            })
            // d.setTitle(lineName + '-' + (f + 1) + '号节点:' + now_arr[f].name) // 设置节点 名称
            middleMarkers.push(d)
          }
          return middleMarkers
        }

        function drawRoute(route, index) {
          const path = parseRouteToPath(route)
          const startMarker = new AMap.Marker({
            position: path[0],
            icon: 'https://webapi.amap.com/theme/v1.3/markers/n/start.png',
            map: mapObj
          })
          const endMarker = new AMap.Marker({
            position: path[path.length - 1],
            icon: 'https://webapi.amap.com/theme/v1.3/markers/n/end.png',
            map: mapObj
          })

          // 生成 折线路线
          routeLine_obj = new AMap.Polyline({
            path: path,
            isOutline: true,
            outlineColor: '#ffeeee',
            borderWeight: 2,
            strokeWeight: 5,
            strokeColor: colors[index] || '#A52A2A',
            lineJoin: 'round'
          })
          routeLine_obj.setMap(mapObj)
          const setFitViewArr = [startMarker, endMarker, routeLine_obj]
          return setFitViewArr
        }

        // 解析DrivingRoute对象,构造成AMap.Polyline的path参数需要的格式
        // DrivingResult对象结构参考文档 https://lbs.amap.com/api/javascript-api/reference/route-search#m_DriveRoute
        function parseRouteToPath(route) {
          const path = []
          for (let i = 0, l = route.steps.length; i < l; i++) {
            const step = route.steps[i]
            for (let j = 0, n = step.path.length; j < n; j++) {
              path.push(step.path[j])
            }
          }
          return path
        }
      }
直接传 经纬度 无效 需,使用 new AMap.LngLat()
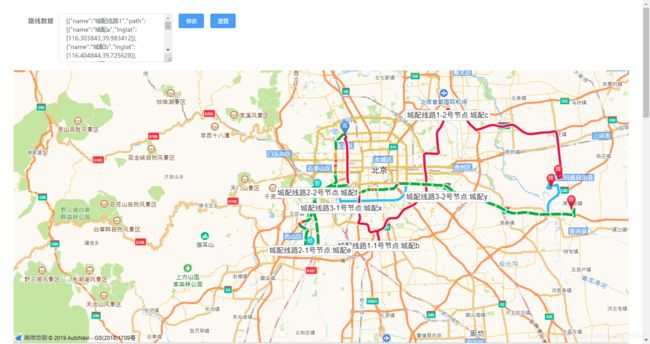
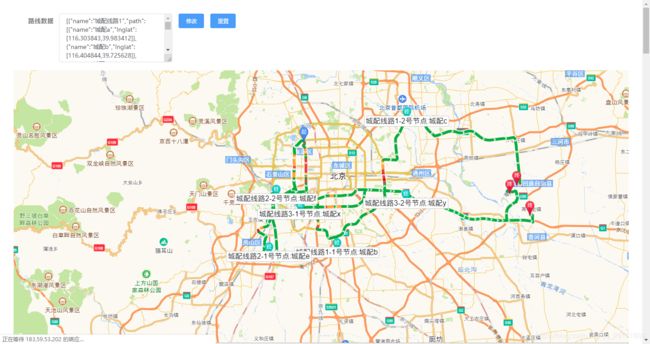
效果图
未解决问题,大家可以明显看见 后几条规划线上没带了 “经”标签点,目前是因为
每个new AMap.Driving 单独对应了实例化一个 panel dom ,然后 渲染线路颜色new AMap.Polyline - strokeColor 颜色设置都是同一个,目前状态 是 ‘颜色区分’ 与 每个线路带‘经’标签点 功能无法兼得。这个问题我后续再研究看看

