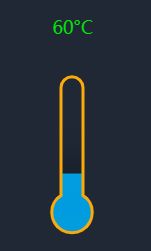
echarts-liquidfill实现温度计样式
echarts-liquidfill实现温度计样式
因为项目需求,要用温度计的样式展示百分比,就找到了echarts-liquidfill,更详细的使用方法请参考npm管网:
https://www.npmjs.com/package/echarts-liquidfill
需要依赖echarts和echarts-liquidfill,版本最好对应,不然可能报错。
可以用npm下载或者yarn下载,
npm install echarts vue-echarts --save
npm install echarts-liquidfill --save
我用的版本
"echarts": "^4.1.0",
"echarts-liquidfill": "^2.0.2",
option的代码
我把option封装成了一个公共的函数,传入data就可以,data为小于1的小数
import 'echarts-liquidfill/src/liquidFill.js';
let common = {};
// 温度计样式
common.Thermometer = (data) => {
    var val =  Number((data.TP_value/data.max_value).toFixed(2))
    var option = {
        title: {
            text: '60°C',
            padding:[-8,0,0,0],
            textStyle:{
                color:'#04e608',
                fontWeight:'normal',
                top:'10%',
            },
            show: true,
            left:'35%',
            top:'10%',
        },
        series: [{
            type: 'liquidFill',
            radius: '120%',  //半径
            center:[ '50%' ,'60%'],  //温度计的位置,第一个参数是水平方向,第二个参数是垂直方向
            waveAnimation :true ,
            amplitude: 0,
            data: [val],  //数据
            color:['#00a3e9'],  //温度计液体的颜色
            shape: 'path://M324.234,516.886c0-41.643,0-252.383,0-258.626c0-14.688-11.906-26.594-26.593-26.594c-14.688,0-26.595,11.906-26.595,26.594c0,5.271,0,216.887,0,258.625c-13.383,8.71-22.24,23.791-22.24,40.949c0,26.97,21.863,48.834,48.834,48.834c26.969,0,48.834-21.864,48.834-48.834C346.475,540.676,337.617,525.596,324.234,516.886z',
            backgroundStyle: {
                color: 'none',
                borderColor: '#faaa0a',  //外框的颜色
                borderWidth: 3,
            },
            outline: {
                show: false
            },
            label: {
                normal: {
                    formatter: ''
                }
            }
        }]
    }
    return option;
}

export default common
在.vue页面中使用,methods中
		var towInChart = this.$echarts.init(document.getElementById('two-in-water'));
      let twoInOpt = this.$common.Thermometer(this.ThermometerData)
      towInChart.setOption(twoInOpt);
data中
ThermometerData:{
   TP_value:50,  //温度计的值
   max_value:130,

 },
https://blog.csdn.net/soldierofyou/article/details/82661263 有刻度的温度计
