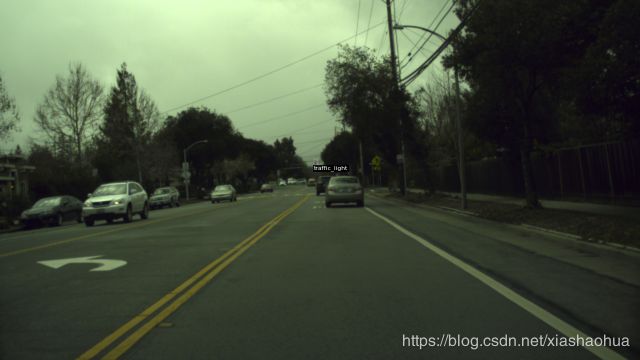
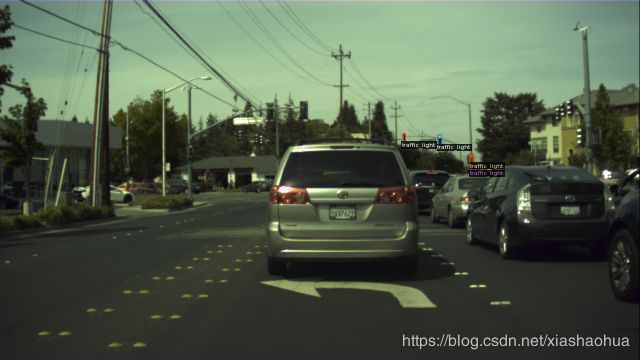
Detectron2-基于bosch交通灯数据集训练交通灯检测模型
思路和代码参考这位小哥的,他使用的是百度数据集,但已经找不到了,所以我使用了bosch的数据集。
https://zhuanlan.zhihu.com/p/89877517
数据集是bosch的,
http://link.zhihu.com/?target=https%3A//hci.iwr.uni-heidelberg.de/node/6132
数据集介绍
https://hci.iwr.uni-heidelberg.de/content/bosch-small-traffic-lights-dataset
Data description
This dataset contains 13427 camera images at a resolution of 1280x720 pixels and contains about 24000 annotated traffic lights. The annotations include bounding boxes of traffic lights as well as the current state (active light) of each traffic light.
The camera images are provided as raw 12bit HDR images taken with a red-clear-clear-blue filter and as reconstructed 8-bit RGB color images. The RGB images are provided for debugging and can also be used for training. However, the RGB conversion process has some drawbacks. Some of the converted images may contain artifacts and the color distribution may seem unusual.
Dataset specifications:
Training set:
-
- 5093 images
- Annotated about every 2 seconds
- 10756 annotated traffic lights
- Median traffic lights width: ~8.6 pixels
- 15 different labels
- 170 lights are partially occluded
Test set:
-
- 8334 consecutive images
- Annotated at about 15 fps
- 13486 annotated traffic lights
- Median traffic light width: 8.5 pixels
- 4 labels (red, yellow, green, off)
- 2088 lights are partially occluded
Bosch有自己的模型脚本,这是基于YOLO1模型实现的。
https://github.com/bosch-ros-pkg/bstld
Detectron2自定义数据训练模型的基本流程还可以参考
https://colab.research.google.com/drive/16jcaJoc6bCFAQ96jDe2HwtXj7BMD_-m5#scrollTo=b2bjrfb2LDeo
对于detection2的自定义数据格式要求见官网
https://detectron2.readthedocs.io/tutorials/datasets.html
实现源码如下(在jupyter notebook下执行):
#1 cell1
import torch
import torchvision
import detectron2
from detectron2.utils.logger import setup_logger
setup_logger()
import numpy as np
import cv2
from matplotlib import pyplot as plt
# import some common detectron2 utilities
from detectron2.engine import DefaultPredictor
from detectron2.config import get_cfg
from detectron2.utils.visualizer import Visualizer
from detectron2.data import MetadataCatalog
def cv_imshow(img):
im = img[:,:,::-1]
fig_h = 12
plt.figure(figsize=(fig_h, int(1.0 * fig_h * im.shape[0] / im.shape[1])))
plt.axis('off')
plt.imshow(im, aspect='auto')
# https://github.com/facebookresearch/detectron2
DETECTRON2_REPO_PATH = './detectron2/'
#2 cell2
# register the traffic light dataset
import os
import numpy as np
import json
import yaml
from detectron2.structures import BoxMode
import itertools
#from tl_dataset import parse_label_file
#dataset_path = "/local/mnt/workspace/myname/dataset/bosch_traffic/rgb/"
dataset_path = "/local/mnt/workspace/myname/dataset/bosch-traffic/"
def get_tl_dicts(data_dir):
dataset_dicts = []
yaml_path = ''
''' data_dir only for check '''
if('train' in data_dir):
yaml_path = os.path.join(data_dir, "train.yaml")
is_train = True
elif('test' in data_dir):
yaml_path = os.path.join(data_dir, "test.yaml")
is_train = False
else:
print("***path error***")
return;
if is_train:
print("***path train***")
yaml_path = os.path.join(dataset_path, "train.yaml")
else:
yaml_path = os.path.join(dataset_path, "test.yaml")
print("***??yaml????***")
file = open(yaml_path, 'r', encoding="utf-8")
file_data = file.read()
file.close()
#print("file_data=", file_data)
#print("file_data type=", type(file_data))
#print("***??yaml????????***")
data = yaml.load(file_data)
for i in range(len(data)):
image_path = os.path.abspath(os.path.join(dataset_path, data[i]['path']))
print('image_path=',image_path)
record = {}
height, width = cv2.imread(image_path).shape[:2]
record["file_name"] = image_path
record["image_id"] = i
record["height"] = height
record["width"] = width
print('width*height=',width,height)
objs = []
for box in data[i]['boxes']:
obj = {
"bbox": [box['x_min'], box['y_min'], box['x_max'], box['y_max']],
"bbox_mode": BoxMode.XYXY_ABS,
"category_id": 0,
"iscrowd": 0
}
print('x_min=',box['x_min'])
'''
if(box['label'] == 'RedLeft'):
obj['category_id'] = 1
if (box['label'] == 'RedRight'):
obj['category_id'] = 2
elif(box['label'] == 'Yellow'):
obj['category_id'] = 10
elif(box['label'] == 'Green'):
obj['category_id'] = 20
elif(box['label'] == 'GreenLeft'):
obj['category_id'] = 21
elif(box['label'] == 'GreenRight'):
obj['category_id'] = 22
else:
obj['category_id'] = 30
'''
objs.append(obj)
record["annotations"] = objs
dataset_dicts.append(record)
return dataset_dicts
#3 cell3
from detectron2.data import DatasetCatalog, MetadataCatalog
for d in ["train", "test"]:
DatasetCatalog.register("/local/mnt/workspace/myname/dataset/bosch-traffic/rgb/" + d, lambda d=d: get_tl_dicts("/local/mnt/workspace/myname/dataset/bosch-traffic/rgb/" + d))
MetadataCatalog.get(dataset_path + d).set(thing_classes=["traffic_light"])
tl_metadata = MetadataCatalog.get(dataset_path+'train')
#4 cell4
# show samples from dataset
import random
from google.colab.patches import cv2_imshow
dataset_dicts = get_tl_dicts(dataset_path+"train")
for d in random.sample(dataset_dicts, 3):
print('file_name=', d["file_name"])
#img_path = os.path.join(dataset_path, d["file_name"])
img_path = d["file_name"]
img = cv2.imread(img_path)
visualizer = Visualizer(img[:, :, ::-1], metadata=tl_metadata, scale=0.5)
vis = visualizer.draw_dataset_dict(d)
cv2_imshow(vis.get_image()[:, :, ::-1])
#5 cell5
# Train
from detectron2.engine import DefaultTrainer
from detectron2.config import get_cfg
cfg = get_cfg()
cfg.merge_from_file(DETECTRON2_REPO_PATH + "./configs/COCO-Detection/faster_rcnn_R_50_FPN_3x.yaml")
cfg.DATASETS.TRAIN = (dataset_path+'rgb/train',)
cfg.DATASETS.TEST = () # no metrics implemented for this dataset
cfg.DATALOADER.NUM_WORKERS = 2
# initialize from model zoo
cfg.MODEL.WEIGHTS = "https://dl.fbaipublicfiles.com/detectron2/COCO-Detection/faster_rcnn_R_50_FPN_3x/137849458/model_final_280758.pkl"
cfg.SOLVER.IMS_PER_BATCH = 2
cfg.SOLVER.BASE_LR = 0.01
cfg.SOLVER.MAX_ITER = 300 # 300 iterations seems good enough, but you can certainly train longer
cfg.MODEL.ROI_HEADS.BATCH_SIZE_PER_IMAGE = 128 # faster, and good enough for this toy dataset
cfg.MODEL.ROI_HEADS.NUM_CLASSES = 1 # only has one class (traffic light)
os.makedirs(cfg.OUTPUT_DIR, exist_ok=True)
print('outdir=',cfg.OUTPUT_DIR)
trainer = DefaultTrainer(cfg)
trainer.resume_or_load(resume=False)
trainer.train()
#6 cell6
# #
cfg.MODEL.WEIGHTS = os.path.join(cfg.OUTPUT_DIR, "model_final.pth")
print('output=',cfg.OUTPUT_DIR)
cfg.MODEL.ROI_HEADS.SCORE_THRESH_TEST = 0.7 # set the testing threshold for this model
cfg.DATASETS.TEST = (dataset_path+'rgb/test', )
predictor = DefaultPredictor(cfg)
#7 cell7
from detectron2.utils.visualizer import ColorMode
from google.colab.patches import cv2_imshow
# testsets contains no label
# dataset_dicts = get_tl_dicts("apollo_tl_demo_data/testsets")
dataset_dicts = get_tl_dicts(dataset_path+'train')
for d in random.sample(dataset_dicts, 3):
im = cv2.imread(d["file_name"])
outputs = predictor(im)
v = Visualizer(im[:, :, ::-1],
metadata=tl_metadata,
scale=0.8,
)
v = v.draw_instance_predictions(outputs["instances"].to("cpu"))
cv2_imshow(v.get_image()[:, :, ::-1])
几点需要注意的地方:
#1, bosch的标注数据格式,是以下面的数据形式组成的数组,每个图片有一个path和一个boxes,boxes包含若干字典,每个字典描述一个交通灯的box信息和相关label等
- boxes:
- {label: RedLeft, occluded: false, x_max: 613.625, x_min: 608.875, y_max: 364.75,
y_min: 354.0}
- {label: Red, occluded: false, x_max: 638.0, x_min: 633.125, y_max: 353.875, y_min: 343.375}
- {label: Red, occluded: false, x_max: 656.875, x_min: 652.875, y_max: 363.5, y_min: 355.375}
path: ./rgb/train/2017-02-03-11-44-56_los_altos_mountain_view_traffic_lights_bag/207458.png
#2 如碰到cv2没有安装的错误,可在terminal下安装pip install -U opencv-python
#3,如脚本使用cv2.imshow不能显示图片,可考虑用cv2_imshow来显示,需要导入
from google.colab.patches import cv2_imshow


