【python】numpy & pandas
来自:Numpy & Pandas 莫烦 python 数据处理
文章目录
- 1 numpy
- 1.1 属性:ndim / shape / size
- 1.2 创建 array:zeros / ones / empty / arrange / linspace
- 1.3 基本运算
- 1.3.1 + / ** / sin / < / ==
- 1.3.2 * / dot / transpose / T
- 1.3.3 sum / min / max
- 1.3.4 argmin / argmax / mean / average / median
- 1.3.5 cumsum / diff / nonzero / sort / clip
- 1.3.6 intersect1d / union1d
- 1.4 Numpy 索引
- 1.5 array 合并和分割
- 1.5.1 合并:vstack / hstack /concatenate
- 1.5.2 分割:vsplit / hsplit / split / array_split
- 1.6 copy & deep copy
- 1.7 补充
- 1.7.1 利用数组访问元素
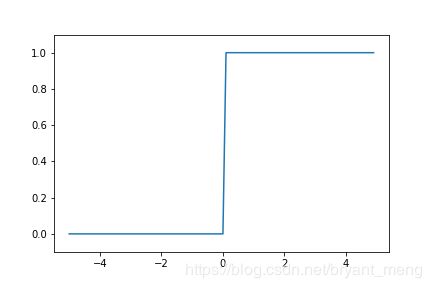
- 1.7.2 数组类型转换(阶跃函数的实现)
- 2 pandas
- 2.1 Series
- 2.2 DataFrame
- 2.2.1 dtypes / index / columns / values
- 2.2.2 describe / T
- 2.2.3 sort_index
- 2.3 Pandas 选择数据
- 2.3.1 简单的筛选
- 2.3.2 loc
- 2.3.3 iloc
- 2.3.4 ix
- 2.3.5 Boolean indexing
- 2.4 Pandas 设置值
- 2.4.1 根据位置设置 loc 和 iloc
- 2.4.2 根据条件设置
- 2.4.3 按行或列设置
- 2.5 Pandas 处理丢失数据
- 2.5.1创建含 NaN 的矩阵
- 2.5.2 pd.dropna()
- 2.5.3 pd.fillna()
- 2.5.4 isnull()
- 2.6 Pandas 文件导入导出
- 2.7 Pandas 合并 concat
- 2.7.1 axis (合并方向)
- 2.7.2 join (合并方式)
- 2.7.3 join_axes (依照 axes 合并)
- 2.7.4 append
- 2.8 Pandas 合并 merge
- 2.8.1 根据某一列合并(on)
- 2.8.2 根据某二列合并(on)
- 2.8.3 indicator=True
- 2.8.4 依据index合并(left_index / right_index)
- 2.8.5 解决overlapping的问题 (suffixes)
- 2.9 Pandas plot 出图
Why Numpy & Pandas?
- 运算速度快:numpy 和 pandas 都是采用 C 语言编写, pandas 又是基于 numpy, 是 numpy 的升级版本。
- 消耗资源少:采用的是矩阵运算,会比 python 自带的字典或者列表快好多
1 numpy
1.1 属性:ndim / shape / size
ndim 和 size 我用的比较少,涨知识了
import numpy as np

a = np.array([[1,2,3],
              [2,3,4]])
print(a)
print('number of dimension:',a.ndim) # 返回数组的维数
print('shape:',a.shape)
print('size:',a.size)
output
[[1 2 3]
 [2 3 4]]
number of dimension: 2
shape: (2, 3)
size: 6
1.2 创建 array:zeros / ones / empty / arrange / linspace
empty 和 linspace 我用的比较少,学习了,empty 视频中是为非常小的值(非零),我这边显示的位数有限,是 0
- array:创建数组
- dtype:指定数据类型
import numpy as np

a = np.array([2,3,4],dtype = np.int)
print(a.dtype)
b = np.array([2,3,4],dtype = np.int64)
print(b.dtype)
c = np.array([2,3,4],dtype = np.float)
print(c.dtype)
d = np.array([2,3,4],dtype = np.float32)
print(d.dtype)
output
int32
int64
float64
float32
- zeros:创建数据全为0
- ones:创建数据全为1
- empty:创建数据接近0
import numpy as np
a = np.array([[1,2,3],
            [4,5,6]])
print(a,'\n')
b = np.zeros((3,4))
print(b,'\n')
c = np.ones((3,4),dtype=np.int16)
print(c,'\n')
d = np.empty((3,4))
print(d,'\n')
output
[[1 2 3]
 [4 5 6]]

[[0. 0. 0. 0.]
 [0. 0. 0. 0.]
 [0. 0. 0. 0.]]

[[1 1 1 1]
 [1 1 1 1]
 [1 1 1 1]]

[[0. 0. 0. 0.]
 [0. 0. 0. 0.]
 [0. 0. 0. 0.]]
- arrange:按指定范围创建数据
- linspace:创建线段
import numpy as np
a = np.arange(12).reshape(3,4) # numpy.ndarray
print(a,'\n')
b = np.linspace(1,10,20).reshape(4,5)
print(b)
output
[[ 0  1  2  3]
 [ 4  5  6  7]
 [ 8  9 10 11]]

[[ 1.          1.47368421  1.94736842  2.42105263  2.89473684]
 [ 3.36842105  3.84210526  4.31578947  4.78947368  5.26315789]
 [ 5.73684211  6.21052632  6.68421053  7.15789474  7.63157895]
 [ 8.10526316  8.57894737  9.05263158  9.52631579 10.        ]]
1.3 基本运算
1.3.1 + / ** / sin / < / ==
用数学的时候,别总想着 import math 哟, numpy 自带的也不错,比如np.sin,注意 <、>、== 可以直接对两个数组进行比较
import numpy as np

x = np.array([10,20,30,40])
y = np.arange(4)
print(x,y,'\n')
c = x+y
print(c,'\n')
d = x**2
print(d,'\n')
e = 10*np.sin(x)# cos
print(e,'\n')
print(y<3,'\n')
print(y==3)
output
[10 20 30 40] [0 1 2 3]

[10 21 32 43]

[ 100  400  900 1600]

[-5.44021111  9.12945251 -9.88031624  7.4511316 ]

[ True  True  True False]

[False False False  True]
1.3.2 * / dot / transpose / T
dot(a,b) 见得多,a.dot(b) 学习到了
import numpy as np

x = np.array([[1,1],
             [0,1]])
y = np.arange(4).reshape(2,2)
print(x,'\n')
print(y,'\n')
c = x*y # element-wise
print(c,'\n')
d1 = np.dot(x,y) # 矩阵乘
print(d1,'\n')

d2 = x.dot(y)# 矩阵乘
print(d2)
output
[[1 1]
 [0 1]]

[[0 1]
 [2 3]]

[[0 1]
 [0 3]]

[[2 4]
 [2 3]]

[[2 4]
 [2 3]]
transpose / T
import numpy as np
A = np.arange(11,-1,-1).reshape((3,4))
print(A,'\n')
print(np.transpose(A),'\n')

print(A.T,'\n')

print((A.T).dot(A))
output
[[11 10  9  8]
 [ 7  6  5  4]
 [ 3  2  1  0]]

[[11  7  3]
 [10  6  2]
 [ 9  5  1]
 [ 8  4  0]]

[[11  7  3]
 [10  6  2]
 [ 9  5  1]
 [ 8  4  0]]

[[179 158 137 116]
 [158 140 122 104]
 [137 122 107  92]
 [116 104  92  80]]
1.3.3 sum / min / max
axis 的介绍可以查看这篇博客。
import numpy as np
a = np.random.random((2,4))
print(a,'\n')
print(np.sum(a),'\n')
print(np.min(a),'\n')
print(np.max(a),'\n')
output
[[0.11554764 0.29960549 0.86234135 0.68197679]
 [0.6658813  0.50246088 0.61024788 0.48163003]]

4.219691351931921

0.11554764097686954

0.8623413474608111
1.3.4 argmin / argmax / mean / average / median
注意 median 是求中位数,mean 和 average 的区别如下
- np.mean直接计算平均数
- np.average计算加权平均数(如果有权重weight的话)
argmin() 和 argmax() 两个函数分别对应着求矩阵中最小元素和最大元素的索引
当然,他们的计算都是可以加入 axis 的。
import numpy as np
A = np.arange(11,-1,-1).reshape((3,4))
print(A,'\n')

print(np.argmin(A))
print(A.argmin(),'\n')

print(np.argmax(A))
print(A.argmax(),'\n')

print(np.mean(A))
print(A.mean(),'\n')

print(np.average(A),'\n')

print(np.median(A),'\n') # 中位数
output
[[11 10  9  8]
 [ 7  6  5  4]
 [ 3  2  1  0]]

11
11

0
0

5.5
5.5

5.5

5.5
1.3.5 cumsum / diff / nonzero / sort / clip
- cumsum:生成的每一项矩阵元素均是从原矩阵首项累加到对应项的元素之和
- diff:该函数默认(axis = 1)计算的便是每一行中后一项与前一项之差
注意,也可以加入 axis 哟
import numpy as np
A = np.arange(11,-1,-1).reshape((3,4))
print(A,'\n')
print(np.cumsum(A),'\n') # 累加
print(np.diff(A),'\n') # 累差
output
[[11 10  9  8]
 [ 7  6  5  4]
 [ 3  2  1  0]]

[11 21 30 38 45 51 56 60 63 65 66 66]

[[-1 -1 -1]
 [-1 -1 -1]
 [-1 -1 -1]]
- nonzero:python numpy中nonzero()的用法
- sort:排序
import numpy as np
A = np.arange(11,-1,-1).reshape((3,4))
print(A)
print(np.nonzero(A)) # 返回数组a中值不为零的元素的下标
print(np.sort(A))
output
[[11 10  9  8]
 [ 7  6  5  4]
 [ 3  2  1  0]]
(array([0, 0, 0, 0, 1, 1, 1, 1, 2, 2, 2], dtype=int64), array([0, 1, 2, 3, 0, 1, 2, 3, 0, 1, 2], dtype=int64))
[[ 8  9 10 11]
 [ 4  5  6  7]
 [ 0  1  2  3]]
nonzero 对于二维,输出的是一个长度为2的元组,第一个元组是行号,第二个是列号,一一依次对应(非零元素的行列号)。
- clip:
import numpy as np
A = np.arange(11,-1,-1).reshape((3,4))
print(A,'\n')
print(np.clip(A,5,9)) # 大于9变成9,小于5变成5
output
[[11 10  9  8]
 [ 7  6  5  4]
 [ 3  2  1  0]]

[[9 9 9 8]
 [7 6 5 5]
 [5 5 5 5]]
1.3.6 intersect1d / union1d
求交集
import numpy as np
list1 = [1,2,3,4,5]
list2 = [2,3,4,5,8]
np.intersect1d(list1,list2)
output
array([2, 3, 4, 5])
求并集
list1 = [1,2,3]
list2 = [2,3,4]
np.union1d(list1,list2)
output
array([1, 2, 3, 4])
1.4 Numpy 索引
import numpy as np
A = np.arange(3,15)
print(A)
print(A[3],'\n')

B = np.arange(3,15).reshape(3,4)
print(B,'\n')

print(B[1]) # 第1行,0,1,2 行
print(B[1,:],'\n') # 第一行另一种写法

print(B[1,1]) # 第1行,第1列
print(B[1][1],'\n') # 第1行,第1列 另一种写法

print(B[:,0]) # 第0列
print(B[0,1:3],'\n') # 0行,1,2 列

for row in B: # 输出每一行
    print(row)
print('\n')

for column in B.T: # 输出每一列
    print(column)
print('\n')

print(A.flatten())
for item in A.flatten(): # 输出每个元素
    print(item,end = ' ')
output
[ 3  4  5  6  7  8  9 10 11 12 13 14]
6

[[ 3  4  5  6]
 [ 7  8  9 10]
 [11 12 13 14]]

[ 7  8  9 10]
[ 7  8  9 10]

8
8

[ 3  7 11]
[4 5]

[3 4 5 6]
[ 7  8  9 10]
[11 12 13 14]


[ 3  7 11]
[ 4  8 12]
[ 5  9 13]
[ 6 10 14]


[ 3  4  5  6  7  8  9 10 11 12 13 14]
3 4 5 6 7 8 9 10 11 12 13 14
1.5 array 合并和分割
1.5.1 合并:vstack / hstack /concatenate
import numpy as np
A = np.array([1,1,1])
B = np.array([2,2,2])

C = np.vstack((A,B)) # vertical stack
print(C,'\n')

print(A.shape,C.shape,'\n')

D = np.hstack((A,B)) # horizontal stack
print(D,'\n')

print(A[np.newaxis,:],'\n') # 行方面加了一个维度
print(A[:,np.newaxis]) # 列方面加了一个维度
output
[[1 1 1]
 [2 2 2]]

(3,) (2, 3)

[1 1 1 2 2 2]

[[1 1 1]]

[[1]
 [1]
 [1]]
A = np.array([1,1,1])[:,np.newaxis]
B = np.array([2,2,2])[:,np.newaxis]

C = np.vstack((A,B))
print(C,'\n')

D = np.hstack((A,B)) # horizontal stack
print(D)
output
[[1]
 [1]
 [1]
 [2]
 [2]
 [2]]

[[1 2]
 [1 2]
 [1 2]]
更加灵活的 concatenate
A = np.array([1,1,1])[:,np.newaxis]
B = np.array([2,2,2])[:,np.newaxis]

C = np.concatenate((A,B,A),axis = 0)
print(C,'\n')
D = np.concatenate((A,B,A),axis = 1)
print(D)
output
[[1]
 [1]
 [1]
 [2]
 [2]
 [2]
 [1]
 [1]
 [1]]

[[1 2 1]
 [1 2 1]
 [1 2 1]]
1.5.2 分割:vsplit / hsplit / split / array_split
import numpy as np
A = np.arange(12).reshape((3,4))
print(A,'\n')

# 等量分割
print(np.split(A,2,axis = 1),'\n') # 4列分成2块
print(np.split(A,3,axis = 0),'\n') # 3行分成3块

# 不等量分割
print(np.array_split(A,3,axis = 1),'\n') # 4 列 2,1,1

# vertical 和 horizontal 分割
print(np.vsplit(A,3),'\n')
print(np.hsplit(A,2))
output
[[ 0  1  2  3]
 [ 4  5  6  7]
 [ 8  9 10 11]]

[array([[0, 1],
       [4, 5],
       [8, 9]]), array([[ 2,  3],
       [ 6,  7],
       [10, 11]])]

[array([[0, 1, 2, 3]]), array([[4, 5, 6, 7]]), array([[ 8,  9, 10, 11]])]

[array([[0, 1],
       [4, 5],
       [8, 9]]), array([[ 2],
       [ 6],
       [10]]), array([[ 3],
       [ 7],
       [11]])]

[array([[0, 1, 2, 3]]), array([[4, 5, 6, 7]]), array([[ 8,  9, 10, 11]])]

[array([[0, 1],
       [4, 5],
       [8, 9]]), array([[ 2,  3],
       [ 6,  7],
       [10, 11]])]
1.6 copy & deep copy
python】特色数据类型——列表(列表、元组、字典、集合)(5) 5.3 list[:] 是关于 list 的 copy 和 deep copy
【python】特色数据类型——字典(列表、元组、字典、集合)(7) 7 字典的复制 是关于自字典的 copy 和 deep copy
先看看浅层复制
import numpy as np
a = np.arange(4)
b = a
print(a,b,'\n')
a[0] = 1
print(a,b,'\n')
print(b is a)
print(id(a),id(b))
output
[0 1 2 3] [0 1 2 3]

[1 1 2 3] [1 1 2 3]

True
1954397800368 1954397800368
可以总结为敌不动我不动,敌动我就动
再看看 deep copy,用 copy() 实现
import numpy as np
a = np.arange(4)
b = a.copy()
print(a,b,'\n')
a[0] = 1
print(a,b,'\n')
print(b is a)
print(id(a),id(b))
output
[0 1 2 3] [0 1 2 3]

[1 1 2 3] [0 1 2 3]

False
1954397800528 1954397800608
可以总结为,嫁出去的人就像泼出去的水,自立门户,左右不了了
1.7 补充
1.7.1 利用数组访问元素
import numpy as np
x = np.array([[1,2],[3,4],[5,6]])
x = x.flatten() # 多维数组拉成一维
print("after flatten:",x)
print("数组索引:",x[np.array([0,2,4])])
print("判断:",x>3)
print("根据判断的结果筛选:",x[x>3])
output
after flatten: [1 2 3 4 5 6]
数组索引: [1 3 5]
判断: [False False False  True  True  True]
根据判断的结果筛选: [4 5 6]
1.7.2 数组类型转换(阶跃函数的实现)
import numpy as np
x = np.array([[1,2],[3,4],[5,6]])
y  = x.astype(np.float)
print(y)
output
[[1. 2.]
 [3. 4.]
 [5. 6.]]
显而易见,如果用强制转化 y=int(x) 是达不到目的的!下面见识下灵活应用,比如,把神经网络预测出来的值转化为 0-1标签
import numpy as np
x = np.array([-1,1,2])
y = x > 0 # 用上一节的方法筛选,返回布尔类型的数组
print(y)
y  = y.astype(np.int) # 用本节的方法,将布尔转化为 int
print(y)
或者是阶跃函数的实现
import numpy as np
import matplotlib.pyplot as plt

def step_function(x):
    x = x>0
    return x.astype(np.int)
    #return np.array(x>0,dtype=np.int) # 或者只用这一句就可以了

x = np.arange(-5.0,5.0,0.1)
y = step_function(x)
plt.plot(x,y)
plt.ylim(-0.1,1.1)
#plt.savefig("1.png")
plt.show()
2 pandas
https://morvanzhou.github.io/tutorials/data-manipulation/np-pd/3-1-pd-intro/
如果用 python 的列表和字典来作比较, 那么可以说 Numpy 是列表形式的,没有数值标签,而 Pandas 就是字典形式。Pandas是基于Numpy构建的,让Numpy为中心的应用变得更加简单。
要使用pandas,首先需要了解他主要两个数据结构:Series和DataFrame。
2.1 Series
import pandas as pd
import numpy as np

s = pd.Series([1,3,6,np.nan,44,1])
s
output
0     1.0
1     3.0
2     6.0
3     NaN
4    44.0
5     1.0
dtype: float64
Series 的字符串表现形式为:索引在左边,值在右边。由于我们没有为数据指定索引。于是会自动创建一个0到N-1(N为长度)的整数型索引。
2.2 DataFrame
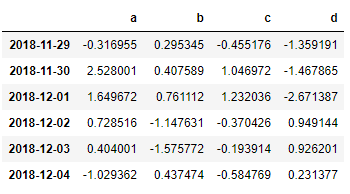
DataFrame 是一个表格型的数据结构,它包含有一组有序的列,每列可以是不同的值类型(数值,字符串,布尔值等)。DataFrame 既有行索引也有列索引, 它可以被看做由Series组成的大字典。
dates = pd.date_range('20181129',periods=6)
print(dates)
df = pd.DataFrame(np.random.randn(6,4),index=dates,columns=['a','b','c','d'])
df
output
DatetimeIndex(['2018-11-29', '2018-11-30', '2018-12-01', '2018-12-02',
               '2018-12-03', '2018-12-04'],
              dtype='datetime64[ns]', freq='D')
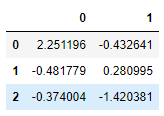
df = pd.DataFrame(np.random.randn(3,2))
df
2.2.1 dtypes / index / columns / values
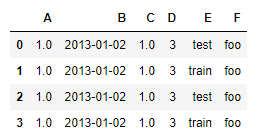
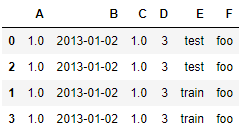
df2 = pd.DataFrame({'A' : 1.,
                    'B' : pd.Timestamp('20130102'),
                    'C' : pd.Series(1,index=list(range(4)),dtype='float32'),
                    'D' : np.array([3] * 4,dtype='int32'),
                    'E' : pd.Categorical(["test","train","test","train"]),
                    'F' : 'foo'})
df2
- dtypes
df2.dtypes
output
A           float64
B    datetime64[ns]
C           float32
D             int32
E          category
F            object
dtype: object
- index
df2.index # 行索引
output
Int64Index([0, 1, 2, 3], dtype='int64')
- columns
df2.columns # 列索引
output
Index(['A', 'B', 'C', 'D', 'E', 'F'], dtype='object')
- values
df2.values # 值
output
array([[1.0, Timestamp('2013-01-02 00:00:00'), 1.0, 3, 'test', 'foo'],
       [1.0, Timestamp('2013-01-02 00:00:00'), 1.0, 3, 'train', 'foo'],
       [1.0, Timestamp('2013-01-02 00:00:00'), 1.0, 3, 'test', 'foo'],
       [1.0, Timestamp('2013-01-02 00:00:00'), 1.0, 3, 'train', 'foo']],
      dtype=object)
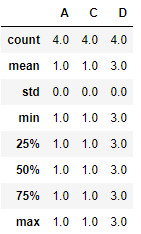
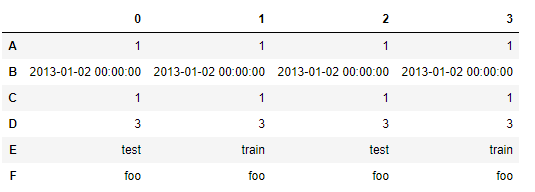
2.2.2 describe / T
df2.describe()
df2.T
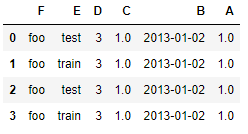
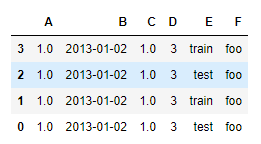
2.2.3 sort_index
df2.sort_index(axis=1,ascending=False) #列降序
df2.sort_index(axis=0,ascending=False) # 行降序
df2.sort_values(by='E') # E列的值排序
2.3 Pandas 选择数据
2.3.1 简单的筛选
import pandas as pd
import numpy as np

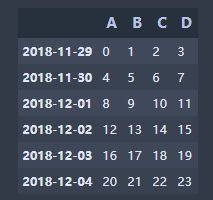
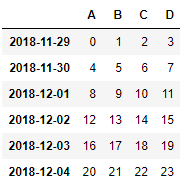
dates = pd.date_range('20181129',periods=6)
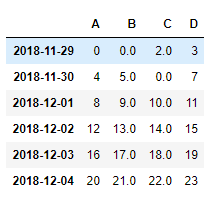
df = pd.DataFrame(np.arange(24).reshape((6,4)),index=dates,columns=['A','B','C','D'])
df
print(df['A'],'\n')
print(df.A)
output
2018-11-29     0
2018-11-30     4
2018-12-01     8
2018-12-02    12
2018-12-03    16
2018-12-04    20
Freq: D, Name: A, dtype: int32

2018-11-29     0
2018-11-30     4
2018-12-01     8
2018-12-02    12
2018-12-03    16
2018-12-04    20
Freq: D, Name: A, dtype: int32
取前 3 行两种等价的写法
print(df[0:3],'\n')
print(df['20181129':'20181201'])
output
            A  B   C   D
2018-11-29  0  1   2   3
2018-11-30  4  5   6   7
2018-12-01  8  9  10  11

            A  B   C   D
2018-11-29  0  1   2   3
2018-11-30  4  5   6   7
2018-12-01  8  9  10  11
2.3.2 loc
# select by label:loc
print(df.loc['20181130'],'\n') # index
print(df.loc['20181130',['A','B']],'\n') # index
print(df.loc[:,['A','B']])
output
A    4
B    5
C    6
D    7
Name: 2018-11-30 00:00:00, dtype: int32

A    4
B    5
Name: 2018-11-30 00:00:00, dtype: int32

             A   B
2018-11-29   0   1
2018-11-30   4   5
2018-12-01   8   9
2018-12-02  12  13
2018-12-03  16  17
2018-12-04  20  21
2.3.3 iloc
# select by positio: iloc
print(df.iloc[3],'\n')
print(df.iloc[3,1],'\n')
print(df.iloc[3:5,1:3],'\n')
print(df.iloc[[1,3,5],1:3])
output
A    12
B    13
C    14
D    15
Name: 2018-12-02 00:00:00, dtype: int32

13

             B   C
2018-12-02  13  14
2018-12-03  17  18

             B   C
2018-11-30   5   6
2018-12-02  13  14
2018-12-04  21  22
2.3.4 ix
# mixed selection: ix
print(df.ix[:3,['A','C']],'\n')
print(df.ix['20181129':'20181201',[0,2]])
output
            A   C
2018-11-29  0   2
2018-11-30  4   6
2018-12-01  8  10

            A   C
2018-11-29  0   2
2018-11-30  4   6
2018-12-01  8  10
总结,跨行的话用 [] 框出来[[X,Y],Z],索引的话不用框出来, [X,Y] 即可
2.3.5 Boolean indexing
# boolean indexing
print(df,'\n')
print(df.A>8,'\n') # 对A列进行选择,返回 A 列的是 True 和 False
print(df[df.A>8]) # 返回 True 的数据
output
             A   B   C   D
2018-11-29   0   1   2   3
2018-11-30   4   5   6   7
2018-12-01   8   9  10  11
2018-12-02  12  13  14  15
2018-12-03  16  17  18  19
2018-12-04  20  21  22  23

2018-11-29    False
2018-11-30    False
2018-12-01    False
2018-12-02     True
2018-12-03     True
2018-12-04     True
Freq: D, Name: A, dtype: bool

             A   B   C   D
2018-12-02  12  13  14  15
2018-12-03  16  17  18  19
2018-12-04  20  21  22  23
2.4 Pandas 设置值
2.4.1 根据位置设置 loc 和 iloc
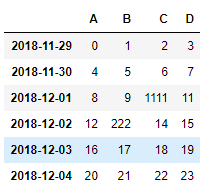
import pandas as pd
dates = pd.date_range('20181129',periods=6)
df = pd.DataFrame(np.arange(24).reshape(6,4),index=dates,columns=['A','B','C','D'])
df
df.iloc[2,2] = 1111
df.loc['2018-12-02','B'] = 222
df
2.4.2 根据条件设置
import pandas as pd
dates = pd.date_range('20181129',periods=6)
df = pd.DataFrame(np.arange(24).reshape(6,4),index=dates,columns=['A','B','C','D'])
print(df,'\n')
df[df.A>4] = 0
print(df)
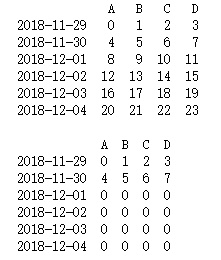
只筛选A的话,用如下的方式
import pandas as pd
dates = pd.date_range('20181129',periods=6)
df = pd.DataFrame(np.arange(24).reshape(6,4),index=dates,columns=['A','B','C','D'])
df.A[df.A>4] = 0
df
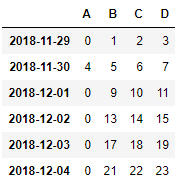
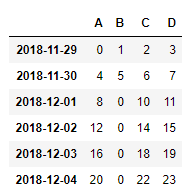
import pandas as pd
dates = pd.date_range('20181129',periods=6)
df = pd.DataFrame(np.arange(24).reshape(6,4),index=dates,columns=['A','B','C','D'])
df.B[df.A>4] = 0 # B列中,A列大于0的都变成0
df
2.4.3 按行或列设置
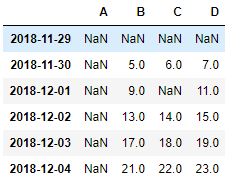
import pandas as pd
import numpy as np

dates = pd.date_range('20181129',periods=6)
df = pd.DataFrame(np.arange(24).reshape(6,4),index=dates,columns=['A','B','C','D'])
df.loc['2018-11-29',:] = np.nan # 整行都设置为nan
df.loc[:,'A'] = np.nan # 整列都设置为 nan
df.iloc[2,2] = np.nan # 设置某一个位置的值为nan
df
import pandas as pd
import numpy as np

dates = pd.date_range('20181129',periods=6)
df = pd.DataFrame(np.arange(24).reshape(6,4),index=dates,columns=['A','B','C','D'])
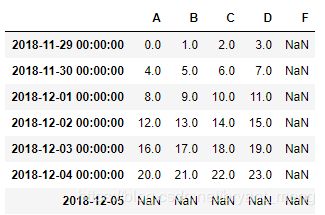
df['F'] = np.nan # 添加列
df.loc['2018-12-05'] = np.nan # 添加行
df
2.5 Pandas 处理丢失数据
2.5.1创建含 NaN 的矩阵
import pandas as pd
import numpy as np
dates = pd.date_range('20181129',periods=6)
df = pd.DataFrame(np.arange(24).reshape(6,4),index=dates,columns=['A','B','C','D'])
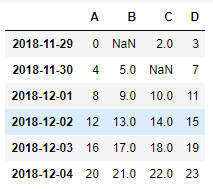
df.iloc[0,1] = np.nan
df.iloc[1,2] = np.nan
df
2.5.2 pd.dropna()
如果想直接去掉有 NaN 的行或列, 可以使用 dropna
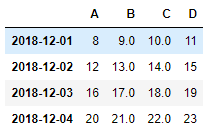
1)去掉有 nan 的所有行
df.dropna(axis=0)
df.dropna(axis=1)
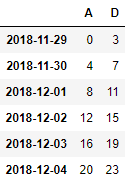
3)how的设置
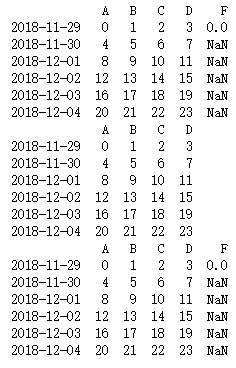
默认为 any,行列中只要有nan就删掉,也可以换成 all,所有的行或者列为nan才删掉
import pandas as pd
import numpy as np

dates = pd.date_range('20181129',periods=6)
df = pd.DataFrame(np.arange(24).reshape(6,4),index=dates,columns=['A','B','C','D'])
df['F'] = np.nan
df.iloc[0,-1] = 0
print(df)
print(df.dropna(axis=1,how='any'))
print(df.dropna(axis=1,how='all'))
2.5.3 pd.fillna()
如果是将 NaN 的值用其他值代替, 比如代替成 0
import pandas as pd
import numpy as np
dates = pd.date_range('20181129',periods=6)
df = pd.DataFrame(np.arange(24).reshape(6,4),index=dates,columns=['A','B','C','D'])
df.iloc[0,1] = np.nan
df.iloc[1,2] = np.nan
df.fillna(value=0)
2.5.4 isnull()
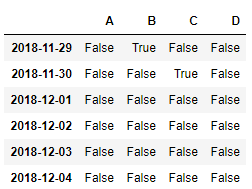
判断是否有缺失数据 NaN, 为 True 表示缺失数据
import pandas as pd
import numpy as np
dates = pd.date_range('20181129',periods=6)
df = pd.DataFrame(np.arange(24).reshape(6,4),index=dates,columns=['A','B','C','D'])
df.iloc[0,1] = np.nan
df.iloc[1,2] = np.nan
df.isnull()
结合 np.any() 使用会更好
import pandas as pd
import numpy as np
dates = pd.date_range('20181129',periods=6)
df = pd.DataFrame(np.arange(24).reshape(6,4),index=dates,columns=['A','B','C','D'])
df.iloc[0,1] = np.nan
df.iloc[1,2] = np.nan
np.any(df.isnull()==True)
ouput
True
2.6 Pandas 文件导入导出
很简单便捷,导入都用read_XXX,导出都用to_XXX
http://pandas.pydata.org/pandas-docs/stable/io.html
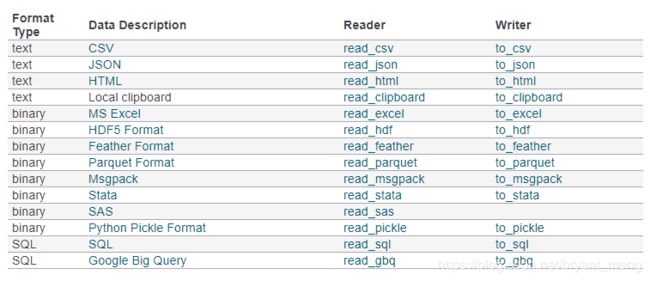
新建一个 excel 试验下

1)导入
import pandas as pd
data = pd.read_excel('C://Users/Administrator/Desktop/1.xlsx')
print(data)
output
   StudentID name  age genda
0          1    A   18     男
1          2    B   19     女
会默认给你添加 index
2)导出
data.to_pickle('C://Users/Administrator/Desktop/student.pickle')
在指定目录下会有student.pickle文件生成,方便。
2.7 Pandas 合并 concat
pandas处理多组数据的时候往往会要用到数据的合并处理,使用 concat是一种基本的合并方式.而且concat中有很多参数可以调整,合并成你想要的数据形式.
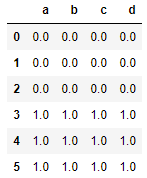
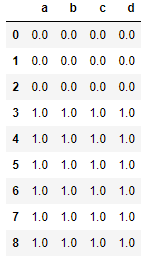
2.7.1 axis (合并方向)
import pandas as pd
import numpy as np
df1 = pd.DataFrame(np.ones((2,2))*0, columns=['a','b'])
df2 = pd.DataFrame(np.ones((2,2))*1, columns=['a','b'])
df3 = pd.DataFrame(np.ones((2,2))*2, columns=['a','b'])
res = pd.concat([df1,df2,df3],axis=0,ignore_index=True) # index 没有变
res
res = pd.concat([df1,df2,df3],axis=1,ignore_index=True) # index 没有变
res
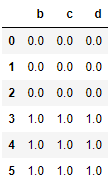
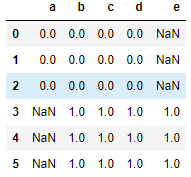
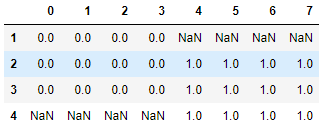
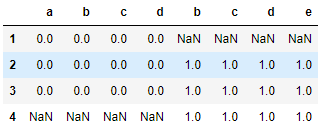
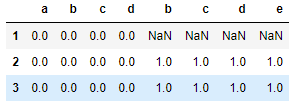
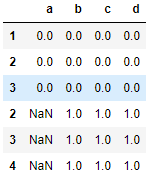
2.7.2 join (合并方式)
join = ['inner','outer']
import pandas as pd
import numpy as np
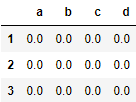
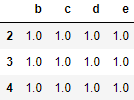
df1 = pd.DataFrame(np.ones((3,4))*0, columns=['a','b','c','d'], index=[1,2,3])
df2 = pd.DataFrame(np.ones((3,4))*1, columns=['b','c','d','e'], index=[2,3,4])
1)inner 只合并相同的index
res = pd.concat([df1,df2],axis=0,join = 'inner',ignore_index=True)
res
res = pd.concat([df1,df2],axis=1,join = 'inner',ignore_index=True)
res
res = pd.concat([df1,df2],axis=0,join = 'outer',ignore_index=True)
res
res = pd.concat([df1,df2],axis=1,join = 'outer',ignore_index=True)
res
2.7.3 join_axes (依照 axes 合并)
import pandas as pd
import numpy as np
df1 = pd.DataFrame(np.ones((3,4))*0, columns=['a','b','c','d'], index=[1,2,3])
df2 = pd.DataFrame(np.ones((3,4))*1, columns=['b','c','d','e'], index=[2,3,4])
res = pd.concat([df1,df2],axis = 1)
res
res = pd.concat([df1,df2],axis = 1,join_axes=[df1.index])
res
依照 df1.columns进行纵向合并
res = pd.concat([df1,df2],axis = 0,join_axes=[df1.columns])
res
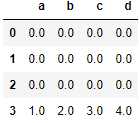
2.7.4 append
append 只有纵向合并,没有横向合并。
df1 = pd.DataFrame(np.ones((3,4))*0, columns=['a','b','c','d'])
df2 = pd.DataFrame(np.ones((3,4))*1, columns=['a','b','c','d'])
df3 = pd.DataFrame(np.ones((3,4))*1, columns=['a','b','c','d'])
s1 = pd.Series([1,2,3,4], index=['a','b','c','d'])
s2 = pd.Series([1,2,3,4], index=['a','b','c','d'])
1)合并 df1 和 df2
res = df1.append(df2,ignore_index=True)
res
res = df1.append([df2,df3],ignore_index=True)
res
res = df1.append(s1,ignore_index=True)
res
2.8 Pandas 合并 merge
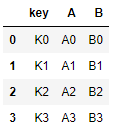
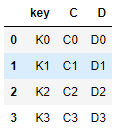
pandas中的merge和concat类似,但主要是用于两组有key column的数据,统一索引的数据. 通常也被用在Database的处理当中.
2.8.1 根据某一列合并(on)
import pandas as pd
left = pd.DataFrame({'key': ['K0', 'K1', 'K2', 'K3'],
                     'A': ['A0', 'A1', 'A2', 'A3'],
                     'B': ['B0', 'B1', 'B2', 'B3']})
right = pd.DataFrame({'key': ['K0', 'K1', 'K2', 'K3'],
                      'C': ['C0', 'C1', 'C2', 'C3'],
                      'D': ['D0', 'D1', 'D2', 'D3']})
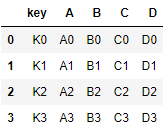
res = pd.merge(left,right,on = 'key')
res
2.8.2 根据某二列合并(on)
import pandas as pd
left = pd.DataFrame({'key1': ['K0', 'K0', 'K1', 'K2'],
                      'key2': ['K0', 'K1', 'K0', 'K1'],
                      'A': ['A0', 'A1', 'A2', 'A3'],
                      'B': ['B0', 'B1', 'B2', 'B3']})
right = pd.DataFrame({'key1': ['K0', 'K1', 'K1', 'K2'],
                       'key2': ['K0', 'K0', 'K0', 'K0'],
                       'C': ['C0', 'C1', 'C2', 'C3'],
                       'D': ['D0', 'D1', 'D2', 'D3']})
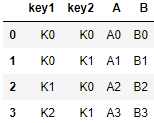
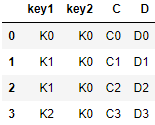
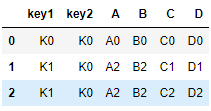
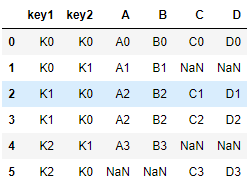
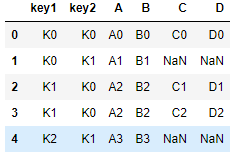
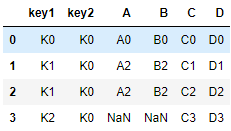
依据key1与key2 columns进行合并,并打印出四种结果[‘left’, ‘right’, ‘outer’, ‘inner’],默认设置的是'inner'
- inner
内连接,取交集
res = pd.merge(left,right,on=['key1','key2'],how = 'inner')
res
- outer
外链接,取并集,并用nan填充
res = pd.merge(left,right,on=['key1','key2'],how = 'outer')
res
- left
左连接,左侧DataFrame取全部,右侧DataFrame取部分
res = pd.merge(left,right,on=['key1','key2'],how = 'left')
res
- right
右连接,右侧DataFrame取全部,左侧DataFrame取部分
res = pd.merge(left,right,on=['key1','key2'],how = 'right')
res
2.8.3 indicator=True
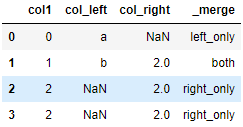
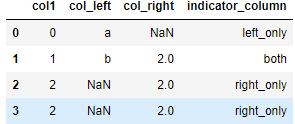
indicator=True会将合并的记录放在新的一列。
import pandas as pd
df1 = pd.DataFrame({'col1':[0,1], 'col_left':['a','b']})
df2 = pd.DataFrame({'col1':[1,2,2],'col_right':[2,2,2]})
res = pd.merge(df1, df2, on='col1', how='outer', indicator=True)
res
res = pd.merge(df1, df2, on='col1', how='outer', indicator='indicator_column')
res
2.8.4 依据index合并(left_index / right_index)
import pandas as pd
left = pd.DataFrame({'A': ['A0', 'A1', 'A2'],
                     'B': ['B0', 'B1', 'B2']},
                     index=['K0', 'K1', 'K2'])
right = pd.DataFrame({'C': ['C0', 'C2', 'C3'],
                      'D': ['D0', 'D2', 'D3']},
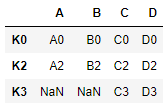
                     index=['K0', 'K2', 'K3'])
注意 left_index 和 right_index 必须是 True
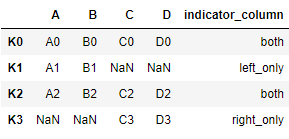
- outer
res = pd.merge(left, right, left_index=True, right_index=True, how='outer',indicator='indicator_column')
res
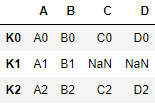
- inner
res = pd.merge(left, right, left_index=True, right_index=True, how='inner',indicator='indicator_column')
res
- left
res = pd.merge(left, right, left_index=True, right_index=True, how='left')
res
- right
res = pd.merge(left, right, left_index=True, right_index=True, how='right')
res
2.8.5 解决overlapping的问题 (suffixes)
import pandas as pd
boys = pd.DataFrame({'k': ['K0', 'K1', 'K2'], 'age': [1, 2, 3]})
girls = pd.DataFrame({'k': ['K0', 'K0', 'K3'], 'age': [4, 5, 6]})
res = pd.merge(boys, girls, on='k', how='inner')
res
res = pd.merge(boys, girls, on='k', suffixes=['_boy', '_girl'], how='inner')
res
2.9 Pandas plot 出图
import pandas as pd
import matplotlib.pyplot as plt
import numpy as np
# plot data
#Series
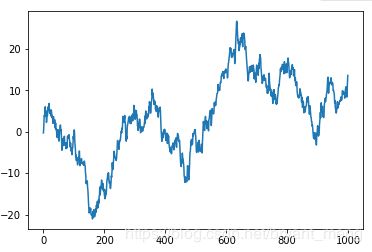
data = pd.Series(np.random.randn(1000),index=np.arange(1000))
# 为了方便观看效果, 我们累加这个数据
data = data.cumsum()
data.plot()
plt.show()
import pandas as pd
import matplotlib.pyplot as plt
import numpy as np

# plot data
#Series
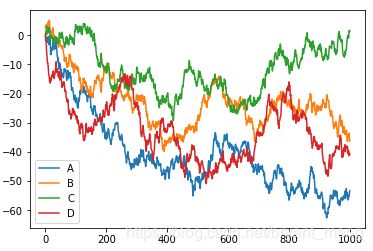
data = pd.DataFrame(np.random.randn(1000,4),
                    index=np.arange(1000),
                    columns=['A','B','C','D'])
data = data.cumsum()
data.plot()
# plot methods:
# bar, hist,box,kde,area,scatter,hexbin,pie
ax = data.plot.scatter(x='A',y='B',color='DarkBlue',label='Class 1')
data.plot.scatter(x='A',y='C',color='DarkGreen',label='Class 2',ax = ax)
plt.show()
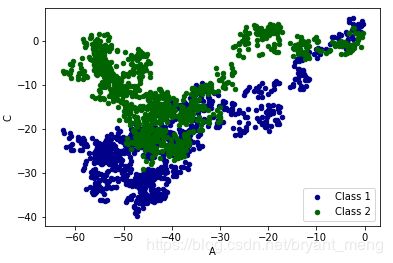
padans 画图官方文档
http://pandas.pydata.org/pandas-docs/version/0.18.1/visualization.html
为什么用 Numpy 还是慢, 你用对了吗?
https://morvanzhou.github.io/tutorials/data-manipulation/np-pd/4-1-speed-up-numpy/
