Matalb--读取图像及像素值
彩色图像是由G、R、B三中颜色像素合成的,图像矩阵的原点一般算法选择在图像的左上角,向右为x,向下为y,即(0,0)。
彩色图像形成的三维数组中前两位表示图像的像素点的坐标,第三位为1时表示是图像中R的值,为2时表示G的值,为3时表示B的值。
代码实现如下
clc;
clear;
%读入原图像及获取大小
image = imread('lena.jpg');
% 分别读取R、G、B值
image_r=image(:,:,1);
image_g=image(:,:,2);
image_b=image(:,:,3);
image_gray=rgb2gray(image);%将彩图转换为灰度图
hist_image=imhist(image);%计算总图直方图
hist_gray=imhist(image_gray);%计算灰度直方图
hist_r=imhist(image_r);%计算Red部分直方图
hist_g=imhist(image_g);%计算Green部分直方图
hist_b=imhist(image_b);%计算Blue部分直方图
% 测试RGB输出
figure(1);%在窗口1中显示原图、灰度图及R、G、B图
subplot(2,3,1),imshow(image),title('Original image');
subplot(2,3,2),imshow(image_gray),title('Gray image');
subplot(2,3,3),imshow(image_r),title('Red component');
subplot(2,3,4),imshow(image_g),title('Green component');
subplot(2,3,5),imshow(image_g),title('Blue component');
% 画直方图
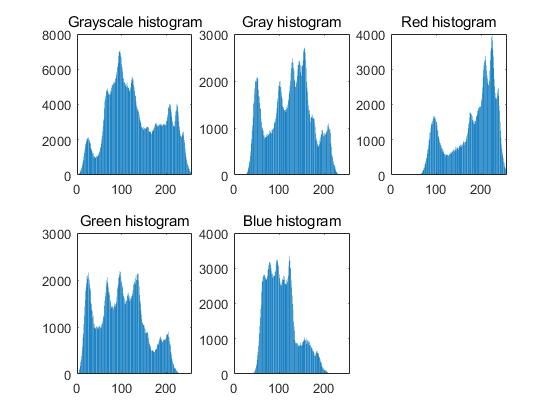
figure(2);
subplot(2,3,1),bar(hist_image),title('Grayscale histogram');%画总直方图
subplot(2,3,2),bar(hist_gray),title('Gray histogram');%画灰度直方图
subplot(2,3,3),bar(hist_r),title('Red histogram');%画Red部分直方图
subplot(2,3,4),bar(hist_g),title('Green histogram');%画Green部分直方图
subplot(2,3,5),bar(hist_b),title('Blue histogram');%画Blue部分直方图效果如下

此图为上图所对应的直方图