上一篇《Linux下Nagios的安装与配置 及遇到的坑 》
Nagios 自带的包里没有直接检查硬盘 I/O 的包: check_iostat,不过可以到官网上下载一个,下载页面是:
http://exchange.nagios.org/directory/Plugins/Operating-Systems/Linux/check_iostat--2D-I-2FO-statistics/details
下载完后直接上传到监控端和被监控端的的:/usr/local/nagios/libexec/ 目录。
给它执行权限:
chmod +x check_iostat
查看它的帮助:
[root@localhost libexec]# ./check_iostat -help
This plugin shows the I/O usage of the specified disk, using the iostat external program.
It prints three statistics: Transactions per second (tps), Kilobytes per second
read from the disk (KB_read/s) and and written to the disk (KB_written/s)
./check_iostat:
-d Device to be checked (without the full path, eg. sda)
-c ,, Sets the CRITICAL level for tps, KB_read/s and KB_written/s, respectively
-w ,, Sets the WARNING level for tps, KB_read/s and KB_written/s, respectively
可以看到,它是用来检查硬盘上每秒数据写入读取的。
参数分别是:
- -d: 要检查的设备名称,不用写全路径
- -c: 当达到多少 KB/S 时就报 CRITICAL 级别的警
- -w: 当达到多少 KB/S 时就报 WARNING 级别的警
查看本机的硬盘信息:
[root@localhost libexec]# df -h
Filesystem            Size  Used Avail Use% Mounted on
/dev/mapper/VolGroup00-LogVol00
                      128G   27G   95G  22% /
/dev/sda1              99M   13M   82M  14% /boot
tmpfs                 4.0G     0  4.0G   0% /dev/shm
上面的信息是 sda1, 那么 -d 后就写 sda
另外,还有可能不是 sda 的,如:
[root@li387-161 ~]# df -h
Filesystem            Size  Used Avail Use% Mounted on
/dev/xvda              79G   38G   40G  49% /
tmpfs                1009M  108K 1009M   1% /dev/shm
上面的情况,-d 后就写 xvda
检查是否能运行:
[root@localhost libexec]# ./check_iostat -d sda -w 1000 -c 2000
//输出 OK - I/O stats tps=1.71 KB_read/s=2.77 KB_written/s=26.77 | 'tps'=1.71; 'KB_read/s'=2.77; 'KB_written/s'=26.77;
如果不能运行,报错,先在本机安装 sysstat:
[root@localhost libexec]# yum install sysstat
如果还报错,那就根据报错的信息一步步解决.
比如我这边报过: bc: command not found ;
解决:
yum install bc
直到上面的 check_iostat 能正确执行,继续配置
Nagios 配置
监控本地
在 commands.cfg 中添加 check_iostat
define command{
        command_name    check_iostat
        command_line    $USER1$/check_iostat -d $ARG1$ -w $ARG2$ -c $ARG3$
}
定义了 check_iostat 命令,且接收三个参数.
更改本地配置文件.假如叫: localhost.cfg
在里面定义一个服务:
define service{
        use                             local-service         ; Name of service template to use
        host_name                       VOD-106       ;服务器名
        service_description             Disk I/O      ; 描述,尽可能不要用中文
check_period                    24x7 ; The service can be checked at any time of the day
        max_check_attempts              3 ; Re-check the service up to 3 times in order to determine its final (hard) state
        normal_check_interval           2 ; Check the service every 10 minutes under normal conditions
        retry_check_interval            1 ; Re-check the service every two minutes until a hard state can be determined
        contact_groups                  admins ; Notifications get sent out to everyone in the 'admins' group
notification_options w,u,c,r,f ; Send notifications about warning, unknown, critical, and recovery events
        notification_interval           1 ;
        notification_period             24x7 ; Notifications can be sent out at any time
check_command check_iostat!sda!1000!2000
}
check_iostat!sda!1000!2000
// 上面共有三个参数: sda, 1000, 2000 分别对应前面 commonds.cfg 中的三个参数.
重新加载配置文件:
service nagios reload
监控远程:
在监控端,修改远程服务器的配置文件.比如: hosts.cfg 文件对应主机的 services.cfg 文件内修改(例如在hosts.cfg,对应3台主机,其中一台名:test.local,那就需要在services.cfg中增加配置如下)
定义命令:
define service{
        use                             generic-service         ; Name of service template to use
        host_name                       test.local      ; 主机名
        service_description             Disk I/O
check_command check_nrpe!check_iostat
}
由于它是通过 check_nrpe 调用远程服务器上的命令.我们要在远程服务器上执行的命令就是这里 check_nrpe 命令的参数,即感叹号后的那个: check_iostat
所以要确保被监控的机器上有 check_iostat 这个命令.安装方式和前面一样.
同时保证 check_nrpe 能顺利调用远程机器.可以通过命令尝试:
[root@localhost libexec]# ./check_nrpe -H 111.111.44.111
NRPE v2.13
然后更改被监控机器上的 /usr/local/nagios/etc/nrpe.cfg
添加命令:
command[check_iostat]=/usr/local/nagios/libexec/check_iostat -d sda -w 1000 -c 2000
重启被监控端的服务:
service xinetd restart
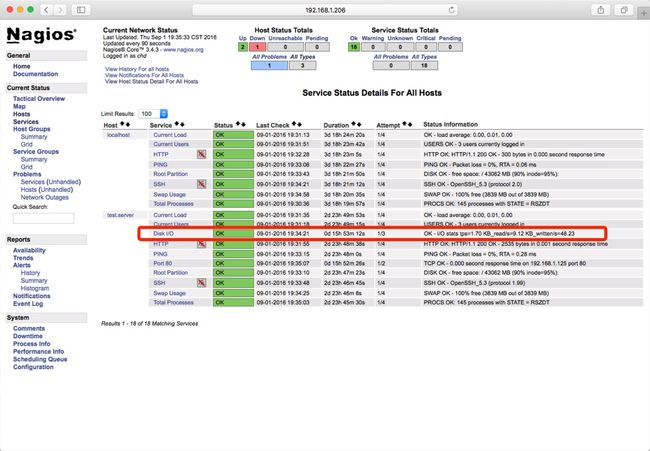
至此从监控主机上可以看到远程/本地磁盘读写信息
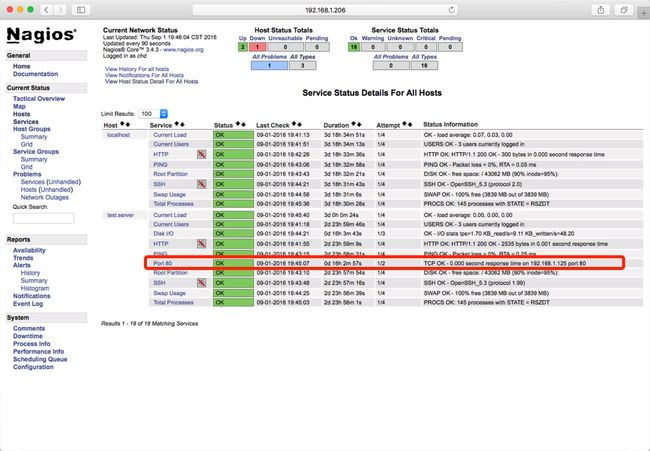
监控指定端口
修改被监控主机 /usr/local/nagios/etc/objects/commands.cfg 添加一个服务名
# check port 4000
define command{
        command_name    Port_80 ; 命令名,后期在监控主机中需要用到
        command_line    $USER1$/check_tcp -H $HOSTADDRESS$ -p 4000 $ARG2$
        }
在监控主机中 services.cfg 中增加监控服务
# Define a service to check HTTP on the local machine.
# Disable notifications for this service by default, as not all users may have HTTP enabled.
define service{
        use                             local-service         ; Name of service template to use
        host_name                     test.local  ; 监控的主机名,需要和hosts.cfg对应
        service_description            80 ; 描述
        check_command                  Port_80 ; 命令,被监控主机定义的
        is_volatile                     0
        check_period                    24x7
        max_check_attempts              2
        normal_check_interval           1
        retry_check_interval            1
        contact_groups                  admins
        notification_options            w,u,c,r
        notification_interval           960
        notification_period             24x7
        }
重启nagios
# service nagios restart
刷新页面如下