python3 用svm实现人脸识别
1,代码实现:
打开spyder,新建svm_sklearn.py
# -*- coding: utf-8 -*-
"""
Created on Sun Aug 25 01:15:48 2019
@author: 14355
"""
from __future__ import print_function
from time import time
import logging
import matplotlib.pyplot as plt
from sklearn.model_selection import train_test_split
from sklearn.datasets import fetch_lfw_people
from sklearn.model_selection import GridSearchCV
#from sklearn.grid_search import GridSearchCV
from sklearn.metrics import classification_report
from sklearn.metrics import confusion_matrix
#from sklearn.decomposition import RandomizedPCA
from sklearn.decomposition import PCA
from sklearn.svm import SVC
print(__doc__)#输出文件开头注释的内容""" """
logging.basicConfig(level=logging.INFO, format='%(asctime)s %(message)s')
# Download the data, if not already on disk and load it as numpy arrays
lfw_people = fetch_lfw_people(min_faces_per_person=70, resize=0.4)
# introspect the images arrays to find the shapes (for plotting)
n_samples, h, w = lfw_people.images.shape
# for machine learning we use the 2 data directly (as relative pixel
# positions info is ignored by this model)
X = lfw_people.data#图片数据
n_features = X.shape[1]#矩阵列数特征点数据1850
# the label to predict is the id of the person
y = lfw_people.target#y是label,有7个目标时,0-6之间取值
target_names = lfw_people.target_names#实际有哪些名字,这个是一个字符串
n_classes = target_names.shape[0]#shape[0]--行维数 shape[1]--列维数
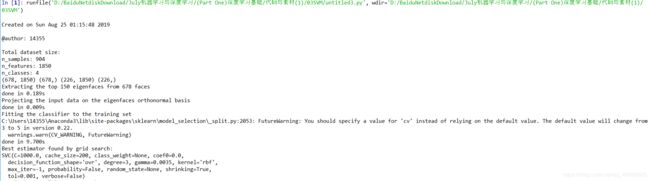
print("Total dataset size:")
print("n_samples: %d\nn_features: %d\nn_classes: %d" % (n_samples,n_features,n_classes))
# Split into a training set and a test set using a stratified k fold
X_train, X_test, y_train, y_test = train_test_split(
X, y, test_size=0.25)
print(X_train.shape,y_train.shape,X_test.shape,y_test.shape)
# Compute a PCA (eigenfaces) on the face dataset (treated as unlabeled
# dataset): unsupervised feature extraction / dimensionality reduction
n_components = 150
print("Extracting the top %d eigenfaces from %d faces"
% (n_components, X_train.shape[0]))
t0 = time()
pca =PCA(svd_solver='randomized',n_components=n_components,whiten=True)#降低维度,提取特征,(此处特征值位度较高)
pca.fit(X,y)#训练如何降维
print("done in %0.3fs" % (time() - t0))
eigenfaces = pca.components_.reshape((n_components,h,w))#三维
#eigenfaces = pca.components_.reshape((n_components, h, w))
print("Projecting the input data on the eigenfaces orthonormal basis")
t0 = time()
X_train_pca = pca.transform(X_train)
X_test_pca = pca.transform(X_test)
print("done in %0.3fs" % (time() - t0))
# Train a SVM classification model
print("Fitting the classifier to the training set")
t0 = time()
param_grid = {'C': [1e3, 998, 1001, 999, 1002],
'gamma': [0.0001, 0.003, 0.0035,0.004,0.0045], }
#clf = GridSearchCV(SVC(kernel='rbf', class_weight='auto'), param_grid)
clf=GridSearchCV(SVC(kernel='rbf',class_weight=None),param_grid)
clf = clf.fit(X_train_pca, y_train)
print("done in %0.3fs" % (time() - t0))
print("Best estimator found by grid search:")
print(clf.best_estimator_)
# Quantitative evaluation of the model quality on the test set
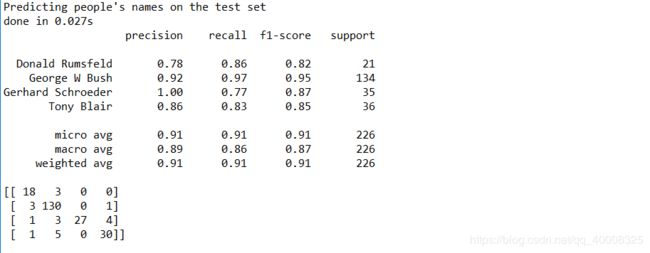
print("Predicting people's names on the test set")
t0 = time()
y_pred = clf.predict(X_test_pca)
print("done in %0.3fs" % (time() - t0))
print(classification_report(y_test, y_pred, target_names=target_names))
print(confusion_matrix(y_test, y_pred, labels=range(n_classes)))
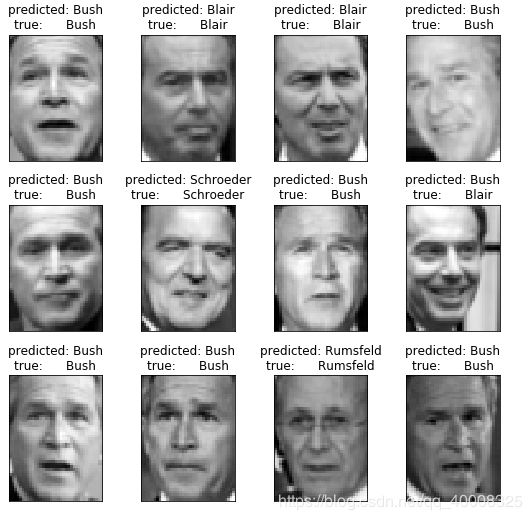
# Qualitative evaluation of the predictions using matplotlib
def plot_gallery(images, titles, h, w, n_row=3, n_col=4):
"""Helper function to plot a gallery of portraits"""
plt.figure(figsize=(1.8 * n_col, 2.4 * n_row))
plt.subplots_adjust(bottom=0, left=.01, right=.99, top=.90, hspace=.35)
for i in range(n_row * n_col):
plt.subplot(n_row, n_col, i + 1)
plt.imshow(images[i].reshape((h, w)), cmap=plt.cm.gray)
plt.title(titles[i], size=12)
plt.xticks(())
plt.yticks(())
# plot the result of the prediction on a portion of the test set
def title(y_pred, y_test, target_names, i):
pred_name = target_names[y_pred[i]].rsplit(' ', 1)[-1]
true_name = target_names[y_test[i]].rsplit(' ', 1)[-1]
return 'predicted: %s\ntrue: %s' % (pred_name, true_name)
prediction_titles = [title(y_pred, y_test, target_names, i)
for i in range(y_pred.shape[0])]
plot_gallery(X_test, prediction_titles, h, w)
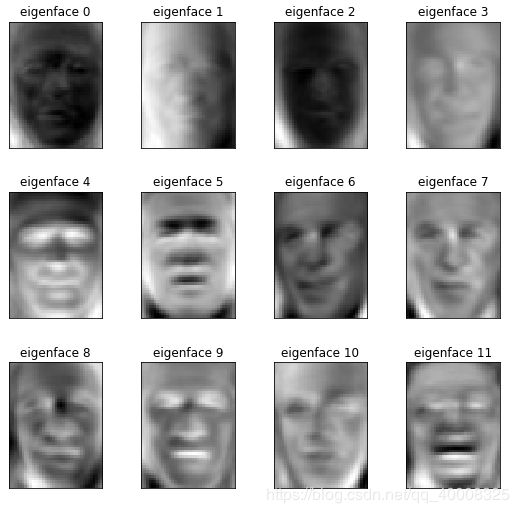
# plot the gallery of the most significative eigenfaces
eigenface_titles = ["eigenface %d" % i for i in range(eigenfaces.shape[0])]
plot_gallery(eigenfaces, eigenface_titles, h, w)
plt.show()2,打印结果:
图片对比结果如下:
3,结果分析: