Echarts 堆叠柱状图显示总数
Echarts 堆叠柱状图显示总数
- 使用echarts 堆叠组装图顶部显示总数
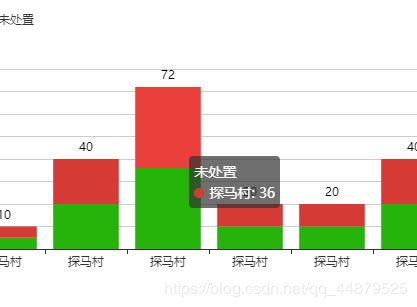
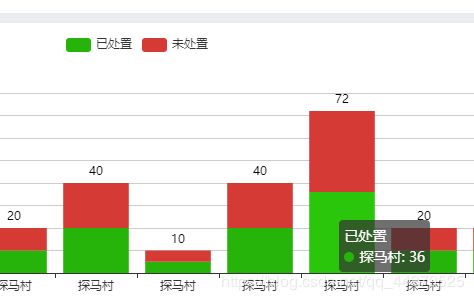
- 效果如图
- 解决办法 :改变series中的项目顺序 将总数的柱子放在最前面
- 代码:
- 效果如图
- 完美解决
使用echarts 堆叠组装图顶部显示总数
直接上代码,原理是在原柱状图旁边在建一个柱子,让他的高度等于堆叠总数,然后向左偏移100%,并设置为透明色;
yjczZzt:{
                        title: {
                            text: '预警处置情况'
                        },
                        tooltip: {},
                        legend: {
                            data:['已处置','未处置']
                        },
                        xAxis: {
                            data: ["探马村","探马村","探马村","探马村","探马村","探马村","探马村","探马村","探马村","探马村","探马村","探马村"]
                        },
                        yAxis: {},
                        series: [{
                            name: '已处置',
                            type: 'bar',
                            stack: "预警",//折叠显示
                            data: [10, 20, 36, 10, 10, 20, 5, 20, 36, 10, 10, 20],
                            color:'#27B40A'
                        },{
                            name: '未处置',
                            type: 'bar',
                            stack: "预警",//折叠显示
                            data: [12, 20, 36, 10, 10, 20, 5, 20, 36, 10, 10, 20],
                            color:"#D53A35"
                        },{                               //新的一个柱子 注意不设stack
                            name: '总数',
                            type: 'bar',
                            barGap: '-100%',         // 左移100%,stack不再与上面两个在一列
                            label: {
                                normal: {
                                    show: true, //显示数值
                                    position: 'top',       //  位置设为top
                                    formatter: '{c}',
                                    textStyle: { color: '#000' } //设置数值颜色
                                }
                            },
                            itemStyle: {
                                normal: {
                                   == color: 'rgba(128, 128, 128, 0)' ==   // 设置背景颜色为透明
                                }
                            },
                            data: [22, 40, 72, 20, 20, 40, 10, 40, 72, 20, 20, 40],
                        }]
                    },
效果如图
解决办法 :改变series中的项目顺序 将总数的柱子放在最前面
代码:
series: [{
                            name: '预警总数',
                            type: 'bar',
                            barGap: '-100%',         // 左移100%,stack不再与上面两个在一列
                            label: {
                                normal: {
                                    show: true,
                                    position: 'top',       //  位置设为top
                                    formatter: '{c}',
                                    textStyle: { color: '#000' }
                                }
                            },
                            itemStyle: {
                                normal: {
                                    color: 'rgba(128, 128, 128, 0.3)'    // 仍为透明
                                }
                            },
                            data: [22, 40, 72, 20, 20, 40, 10, 40, 72, 20, 20, 40],
                        },{
                            name: '已处置',
                            type: 'bar',
                            stack: "预警",//折叠显示
                            data: [10, 20, 36, 10, 10, 20, 5, 20, 36, 10, 10, 20],
                            color:'#27B40A'
                        },{
                            name: '未处置',
                            type: 'bar',
                            stack: "预警",//折叠显示
                            data: [12, 20, 36, 10, 10, 20, 5, 20, 36, 10, 10, 20],
                            color:"#D53A35"
                        }]


