Hyperopt工具包 贝叶斯优化
Hyperopt工具包
一. Bayesian Optimization 贝叶斯优化四大步骤
- Objective 目标函数
- Domain space 指定参数空间
- Hyperparameter optimizationfunction 可选择的采样算法,随机或者贝叶斯优化
- Trials 记录结果的保存
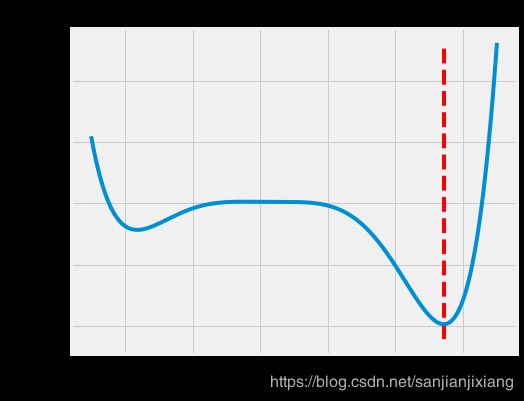
1. Objective 自定义目标, 这里得有一个最小值
import pandas as pd
import numpy as np
import matplotlib.pyplot as plt
import seaborn as sns
%matplotlib inline

def objective(x):
    f = np.poly1d([1, -3, -28, 29, 12, -22, 99])
    # np.poly1d生成多项式, 如np.poly1d([2,3,4])生成2x^2 + 3x + 4
    return f(x) * 0.05

x = np.linspace(-5, 7, 10000)
y = objective(x)

miny = min(y)
minx = x[np.argmin(y)]

plt.figure(figsize = (8, 6))
plt.style.use('fivethirtyeight')
plt.title('Objective Function')
plt.xlabel('x')
plt.ylabel('f(x)')
plt.vlines(minx, min(y)-50, max(y), linestyles='--', colors='r')
plt.plot(x, y)
print('Minimum of %0.4f occurs at %0.4f' % (miny, minx))
Minimum of -394.7324 occurs at 5.4266
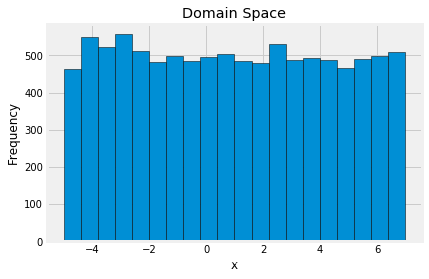
2. Domain 参数取值范围
from hyperopt import hp
space = hp.uniform('x', -5, 7)

from hyperopt.pyll.stochastic import sample
samples = []
for _ in range(10000):
    samples.append(sample(space))

plt.hist(samples, bins = 20, edgecolor = 'black')
plt.xlabel('x'); plt.ylabel('Frequency'); plt.title('Domain Space')
3. 选择采样算法
Hyperparameter Optimization Algorithm 随机或者贝叶斯优化
from hyperopt import rand, tpe
tpe_algo = tpe.suggest
rand_algo = rand.suggest
4. Trials 保存实验结果
from hyperopt import Trials
tpe_trials = Trials()
rand_trials = Trials()
二. 开始运行
from hyperopt import fmin

tpe_best = fmin(fn=objective, space=space, algo=tpe_algo, trials=tpe_trials,
               max_evals=2000, rstate=np.random.RandomState(42))
print(tpe_best)

rand_best = fmin(fn=objective, space=space, algo=rand_algo, trials=rand_trials,
                max_evals=2000, rstate=np.random.RandomState(2))
print(rand_best)
{‘x’: 5.426960403650843}
{‘x’: 5.4302095981113485}
# 看时间效率

%%timeit -n 3 #执行3次
fmin(fn=objective, space=space, algo=tpe_algo, max_evals=200)
411 ms ± 7.62 ms per loop (mean ± std. dev. of 7 runs, 3 loops each)
%%timeit -n 3
fmin(fn=objective, space=space, algo=rand_algo, max_evals=200)
75.5 ms ± 1.03 ms per loop (mean ± std. dev. of 7 runs, 3 loops each)
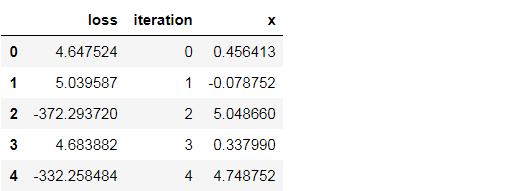
三. 贝叶斯优化结果展示
tpe_results = pd.DataFrame({'loss':[x['loss'] for x in tpe_trials.results],
                           'iteration': tpe_trials.idxs_vals[0]['x'],
                           'x': tpe_trials.idxs_vals[1]['x']})
tpe_results.head()
tpe_results['rolling_average_x'] = tpe_results['x'].rolling(50).mean().fillna(method='bfill')
tpe_results['rolling_average_loss']=tpe_results['loss'].rolling(50).mean().fillna(method='bfill')

plt.figure(figsize = (8, 6))
plt.plot(tpe_results['iterations'], tpe_results['rolling_averange_loss'], 'bo', alpha=0.5)

迭代过程趋势
plt.figure(figsize = (10, 8))
plt.plot(tpe_results['iteration'], tpe_results['x'], 'bo', alpha=0.5)
plt.xlabel('Iteration', size=18)
plt.ylabel('x value', size=18)
plt.title('TPE Sequence of Values', size=24)
plt.hlines(minx, 0, 2000, linestyles='--', color='black')
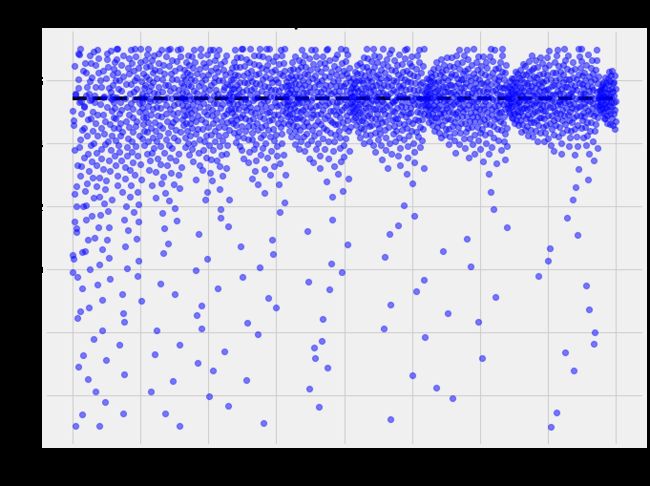
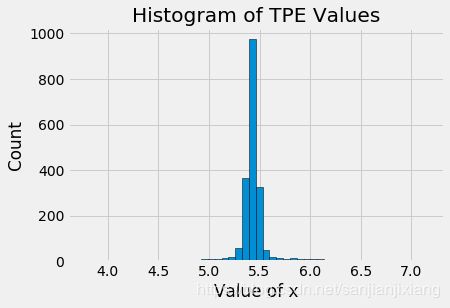
选择了哪些值
tpe_results = tpe_results.sort_values('loss', ascending = True).reset_index()
print('Best Loss of {:.4f} occured at iteration {}'.format(tpe_results['loss'][0], tpe_results['iteration'][0]))

plt.figure(figsize = (8, 6))
plt.hist(tpe_results['x'], bins = 100, edgecolor = 'k')
plt.title('Histogram of TPE Values')
plt.xlabel('Value of x')
plt.ylabel('Count')
Best Loss of -394.7324 occured at iteration 1754

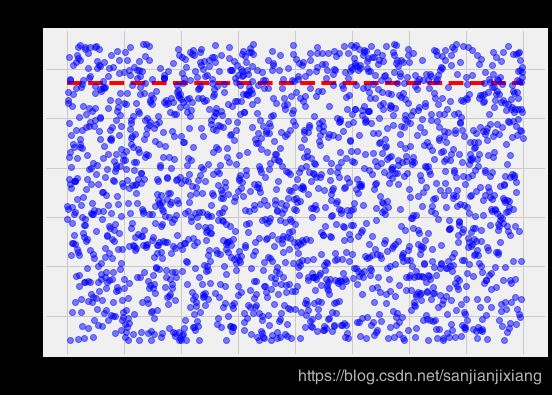
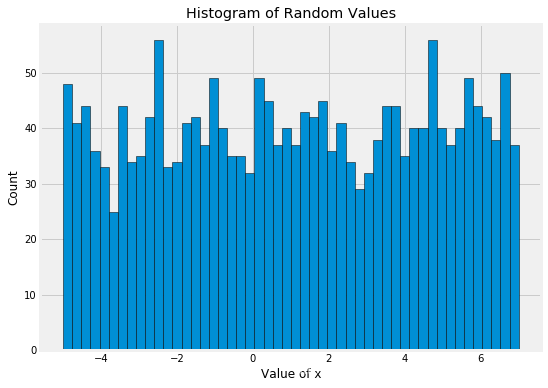
四. 随机优化结果展示
rand_results = pd.DataFrame({'iteration': rand_trials.idxs_vals[0]['x'],
                            'loss': [x['loss'] for x in rand_trials.results],
                            'x': rand_trials.idxs_vals[1]['x']})

plt.figure(figsize = (8, 6))
plt.plot(rand_results['iteration'], rand_results['x'],  'bo', alpha = 0.5)
plt.xlabel('Iteration', size = 16); plt.ylabel('x value', size = 16)
plt.title('Random Sequence of Values', size = 22)
plt.hlines(minx, 0, 2000, linestyles = '--', colors = 'r')
rand_results = rand_results.sort_values('loss', ascending = True).reset_index()
plt.figure(figsize = (8, 6))
plt.hist(rand_results['x'], bins = 50, edgecolor = 'k');
plt.title('Histogram of Random Values')
plt.xlabel('Value of x')
plt.ylabel('Count');

print('Best Loss of {:.4f} occured at iteration {}'.format(rand_results['loss'][0], rand_results['iteration'][0]))
Best Loss of -394.7300 occured at iteration 1828
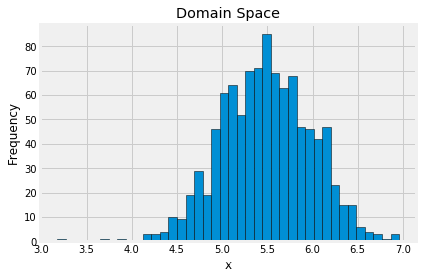
五. 选择更合适的参数空间
space = hp.normal('x', 5.5, 0.5)
# hp.normal(label, mu, sigma) 其中mu和sigma分别是均值和标准差

samples = []
for _ in range(1000):
    samples.append(sample(space))
plt.hist(samples, bins = 40, edgecolor = 'black')
plt.xlabel('x')
plt.ylabel('Frequency')
plt.title('Domain Space')
在字典中放入更多的信息
from hyperopt import STATUS_OK
from timeit import default_timer as timer

def objective(x):
    f = np.poly1d([1, -3, -28, 29, 12, -22, 99])
    start = timer()
    loss = f(x) * 0.05
    end = timer()
    time_elapsed = end - start
    results = {'loss': loss, 'status': STATUS_OK, 'x': x, 'time': time_elapsed}
    return results

trials = Trials()
best = fmin(fn=objective, space=space, algo=tpe_algo, trials=trials,
           max_evals = 2000, rstate = np.random.RandomState(42))
print(best)

results = trials.results
results[:2]
{‘x’: 5.426640182591041}
[{‘loss’: -269.36974822746737, ‘status’: ‘ok’, ‘x’: 6.125403360883173, ‘time’: 7.146499956434127e-05},
{‘loss’: -191.44382020512762, ‘status’: ‘ok’, ‘x’: 6.285993057028011, ‘time’: 3.193099973941571e-05}]
results_df = pd.DataFrame({'time': [x['time'] for x in results],
                           'loss': [x['loss'] for x in results],
                           'x': [x['x'] for x in results],
                            'iteration': list(range(len(results)))})
results_df = results_df.sort_values('loss', ascending = True)
results_df.head()

plt.hist(results_df['x'], bins = 50, edgecolor = 'k')
plt.title('Histogram of TPE Values')
plt.xlabel('Value of x')
plt.ylabel('Count')
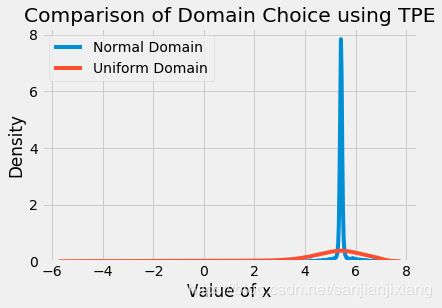
- 不同参数空间效果比较
sns.kdeplot(results_df['x'], label = "Normal Domain")
sns.kdeplot(tpe_results['x'], label = 'Uniform Domain')
plt.legend()
plt.xlabel('Value of x')
plt.ylabel('Density')
plt.title('Comparison of Domain Choice using TPE')