vue基于ECharts的股票行情分时图绘制
vue中ECharts分时图的绘制
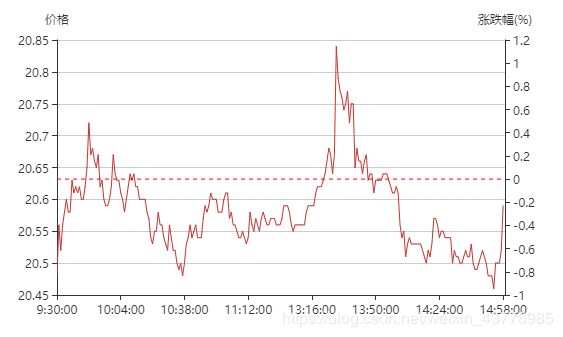
应需求绘制分时图,这里用到的接口是和讯网的,之前也有用到新浪的,区别并不是很大,有的是http有的是https,按需求选择,之后处理数据即可。
先上效果图,有不足欢迎大家指出
echarts图例手册
找到一篇很不错的图例手册,安利给大家echarts图例手册
可自行收藏
各种接口股票接口
这里找到了大佬整理的股票接口 腾讯股票接口、和讯网股票接口、新浪股票接口、雪球股票数据、网易股票数据 有需要可以直接使用
和讯接口 http://webstock.quote.hermes.hexun.com/a/minute?code=sse600000&start=20181026000000&number=500
html部分
这里用到了ref,vue中不推荐直接操作dom,所以最好不要使用document.getElementById的方式
<template>
  <div>
    <div ref="chartMin" style="width:540px;height:300px">div>
  div>
template>
js部分
  export default {
    data() {
      return{
        a: 'sh600000',
        data1: [],
        data2: [],
        data3: [],
      }
    },
    methods: {
      getChart() {
        this.code = (this.a).slice(2);
        if (this.code[0] == 6) {
          this.type = 'sse';
        } else {
          this.type = 'szse';
        }
        // 第三方接口,需要实时刷新用的定时器,并未做websocket的处理,有需要可以自己加
        // this.timer = setInterval(() => {
        // vue项目中为了规范,跨域请求封装了jsonp的方法
        jsonp('http://webstock.quote.hermes.hexun.com/a/minute?code='
        + this.type + this.code + '&start=20181026000000&number=500&callback=chart2', {fn: 'chart2'}).then((res) => {
          const total = res.Data[0];
          for (const j of Object.keys(total)) {
            const time = total[j][0] + '';
            const year = time.slice(0, 4);
            const month = time.slice(4, 6);
            const day = time.slice(6, 8);
            const hour = time.slice(8, 10);
            const minute = time.slice(10, 12);
            const second = time.slice(12, 14);
            const yeartwo = year + '-' + month + '-' + day;
            const timetwo = hour + ':' + minute + ':' + second;
            this.data1.push(timetwo);
            const chartprice = total[j][1] / 100;
            this.data2.push(chartprice);
            //昨收价是从另一个接口获取的
            const chg = parseFloat(Number((chartprice - this.yes) / this.yes * 100)).toFixed(2);
            this.data3.push(chg);
          }

          this.chart.setOption({
          // 图相对于容器的位置
            grid: {
              left: '10%',
              right: '10%',
              bottom: '10%',
            },
            tooltip : {
              trigger: 'axis',
              axisPointer: {
                type: 'cross',
                animation: false,
                label: {
                  backgroundColor: '#505765',
                },
              },
            },
            // 下方滑块
            // dataZoom: [
            //     {
            //         show: true,
            //         realtime: true,
            //     },
            //     {
            //         type: 'inside',
            //         realtime: true,
            //     },
            // ],
            xAxis: [
              {
                type : 'category',
                boundaryGap : false,
                axisLine: {onZero: false},
                data : this.data1
                .map((str) => {
                    return str.replace(' ', '\n');
                }),
              },
            ],
            yAxis: [
              {
                name: '价格',
                type: 'value',
                scale: true,
                splitNumber: 4,
              },
              {
                name: '涨跌幅(%)',
                type: 'value',
                scale: true,
                splitNumber: 4,
                splitLine: false,
              },
            ],
            series: [
              {
                name: '价格',
                type: 'line',
                animation: false,
                symbol: 'none',
                lineStyle: {
                    width: 1,
                },
                data: this.data2,
              },
              {
                name: '涨跌幅',
                type: 'line',
                yAxisIndex: 1,
                animation: false,
                symbol: 'none',
                lineStyle: {
                  width: 1,
                  color: 'transparent',
                },
                markLine: {
                  silent: true,
                  // 去掉箭头
                  symbol: 'none',
                  data: [{
                      yAxis: 0,
                  }],
                  lineStyle: {
                      normal: {
                          type: 'dashed',
                          color: 'red',
                      },
                  },
                  label: {
                    formatter: '',
                  },
                },
                data: this.data3,
              },
            ],
          });
        });
        // },3000);
      },
    },
    initchart() {
      this.chart = echarts.init(this.$refs.chartMin);
    },
    mounted () {
      this.initchart();
    },
  }
以上就是Vue中Echarts的分时图绘制,下次会带来k线图的绘制,有必要的话会加上KDJ,MACD,ENE,BOLL,RSI等技术指标,敬请期待吧!