pyecharts数据可视化
参考连接: https://www.jianshu.com/p/52dbe714d2f6
pyecharts绘图准备
- pyecharts的安装:
首先现需要安装完毕pyecharts库:pip install pyecharts
- 导入相关模块:
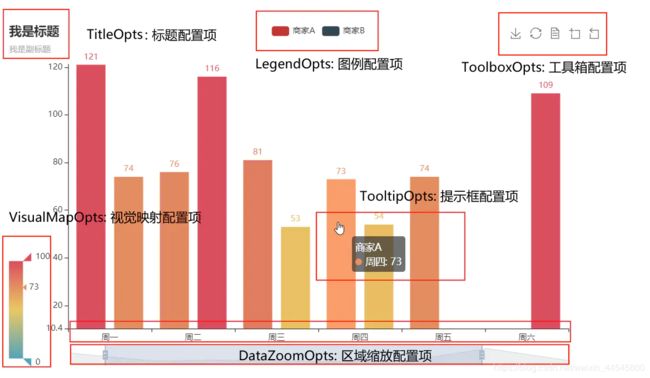
pyecharts库中负责地理坐标系的模块是 Geo,负责地图的模块是 Map,负责百度地图的模块是 BMap,负责图表配置的模块是 options。在 pyecharts 中,图表的一切皆通过 options 来修饰调整。
- 图像显示与输出
在pyecharts中,图表完成制作后通过 render() 函数输出为html文件,你可以在 render(path) 中传递输出地址参数,将html文件保存到自定义的位置。
如果想在notebook中直接展示图表,需要调用 render_notebook() 函数(使用tab有时会显示不出来)。
- 链式调用
链式调用原理:就是作用域链;实现需要做的工作(连续调用)
eg:
Student student = new Student().setStudentName("jhon")  //必须先实例化对象.
              .seAge(18)
              .setSex("M")
              .setNumber("11011010");
对象方法的处理:处理完成返回对象的引用(操作对象)
链式实现的方式:
<1> this的作用域链,jQuery的实现方式;【示例1】
<2> 返回对象本身, 同this的区别就是显示返回链式对象;【示例2】
<3> 闭包返回对象通过调用覆盖valueOf方法实现,副作用获取结果需要调用valueOf;(此种方法适用于操作方法有相互依赖的情况下使用)【示例3】
示例一:
person.set(10).get(); // 我还是个少年
var Person = function() {};
Person.prototype.set = function (age){
    this.age = 10;
    return this; //this调用位置决定其词法作用域
}
Person.prototype.get = function (){
    var age = this.age;
    if(age < 6){
        return '我还是个宝宝';
    }else if(age < 18){
        return '我还是个少年';
    }else{
     //……
    }
}
var person = new Person();
person.set(10).get(); // '我还是个少年'
示例二:
var person = {
    set: function (age){
        this.age = 10;  //this调用位置决定其词法作用域
        return person;
    },
    get: function (){
        var age = this.age;
        if(age < 6){
            return '我还是个宝宝';
        }else if(age < 18){
            return '我还是个少年';
        }else{
         //……
        }
    }
}
示例三:
wordschain('胸有成竹')('竹报平安')('安富尊荣').valueOf()
function wordschain(word){
    var words = word;
    function chain(word){
        words += ' -> ' + word;
        return chain; //操作对象本身
    }
    // valueOf 对象原始值chain [了解更多][5]
    chain.valueOf = function(){
        return words;
    }
    return chain;
}
地理图表显示
文档实例:https://gallery.pyecharts.org/#/EffectScatter/effectscatter_base
中文文档:http://pyecharts.org/#/zh-cn/
英文文档:http://pyecharts.org/#/en-us/
Geo模块
常用的五个函数:
add_schema() :控制地图类型、视角中心点等
add():用于 tooltip 的显示的系列名称、传入数据集、选择geo图类型(scatter, effectScatter, heatmap, lines四种)、调整图例等
set_series_opts() :系列配置项,可配置图元样式、文字样式、标签样式、点线样式等
set_global_opts() : 全局配置项,可配置标题、动画、坐标轴、图例等
render_notebook() : 在notebook中渲染显示图表
from pyecharts import options as opts
from pyecharts.charts import Geo
from pyecharts.faker import Faker
from pyecharts.globals import ChartType
(
    Map(init_opts=opts.InitOpts(width="1400px", height="800px"))
    .add_js_funcs("echarts.registerMap('HK', {});".format(data))##添加js代码
    .add(
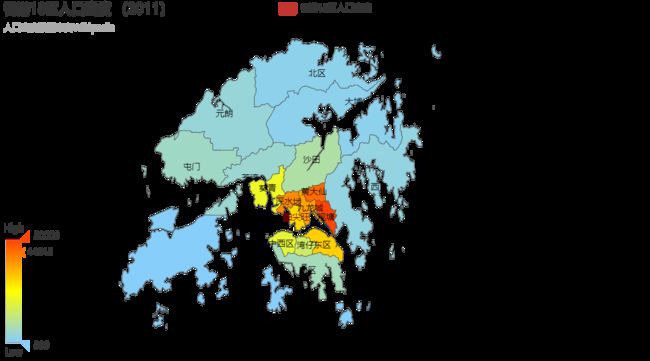
        series_name="香港18区人口密度",
        maptype="HK",
        data_pair=MAP_DATA,
        name_map=NAME_MAP_DATA,
        is_map_symbol_show=False,
    )
    .set_global_opts(
        title_opts=opts.TitleOpts(
            title="香港18区人口密度 (2011)",
            subtitle="人口密度数据来自Wikipedia",
            subtitle_link=WIKI_LINK,
        ),
        tooltip_opts=opts.TooltipOpts(
            trigger="item", formatter="{b}
{c} (p / km2)"
        ),
        visualmap_opts=opts.VisualMapOpts(
            min_=800,
            max_=50000,
            range_text=["High", "Low"],
            is_calculable=True,
            range_color=["lightskyblue", "yellow", "orangered"],
        ),
    )
    .render("population_density_of_HongKong.html")
)
bar显示
add_yaxis():新增y轴数据,
add_xaxis():新增x轴数据
set_series_opts() :系列配置项,可配置图元样式、文字样式、标签样式、点线样式等
set_global_opts() : 全局配置项,可配置标题、动画、坐标轴、图例等
hubei_data=[]
for item in data['results']:
    if item['provinceShortName'] == '湖北':
        hubei_data=item['cities']
bar = (
        Bar(init_opts=opts.InitOpts(theme='dark', width='400'))
        .add_xaxis([x['cityName'] for x in hubei_data])
        .add_yaxis("累计确诊人数", [x['confirmedCount']+0 for x in hubei_data])
        .add_yaxis("当前确诊人数", [x['currentConfirmedCount']+0 for x in hubei_data])
        .set_series_opts(label_opts=opts.LabelOpts(is_show=False))
        .set_global_opts(
            title_opts=opts.TitleOpts(title="新型冠状病毒湖北省内确诊情况",
                                     subtitle="更新日期:{}".format(update_date)),
            xaxis_opts=opts.AxisOpts(axislabel_opts=opts.LabelOpts(rotate=45)),
            legend_opts=opts.LegendOpts(is_show=True),
            graphic_opts=[
                    opts.GraphicGroup(
                        graphic_item=opts.GraphicItem(
                            bounding="raw",
                            right=200,
                            top=120
                        ),
                        children=[
                            opts.GraphicRect(
                                graphic_item=opts.GraphicItem(
                                    left="center", top="center"
                                ),
                                graphic_shape_opts=opts.GraphicShapeOpts(
                                    width=200, height=60
                                ),
                                graphic_basicstyle_opts=opts.GraphicBasicStyleOpts(
                                    fill="rgba(0,0,0,0.3)"
                                ),
                            ),
                            opts.GraphicText(
                                graphic_item=opts.GraphicItem(
                                    left="center", top="center", z=1
                                ),
                                graphic_textstyle_opts=opts.GraphicTextStyleOpts(
                                    text=JsCode("['当前确诊人数:', '','累计确诊人数-死亡人数-治愈人数'].join('\\n')"),
                                    font="bold 12px Microsoft YaHei",
                                    graphic_basicstyle_opts=opts.GraphicBasicStyleOpts(
                                        fill="#fff"
                                    ),
                                ),
                            ),
                        ],
                    )
                ],
                )
        )
词云图
略,见参考文档
案例:
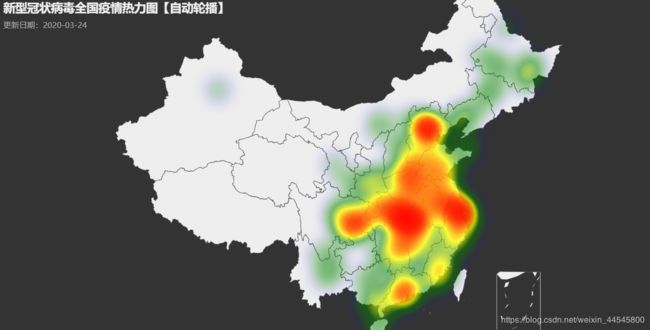
tl = Timeline(init_opts=opts.InitOpts(theme='dark', width='400'))##运用时间线,可以通过说明文档查询
tl.add_schema(axis_type='time', is_auto_play=True, is_timeline_show=False)

for day in time_range: ##循环时间
    geo = (
            Geo(init_opts=opts.InitOpts(theme='dark'))
            .add_schema(maptype="china", zoom=1)
            .add("累计确诊人数",
                 [(key_, value_['confirmedCount']) for key_, value_, in format_data[day].items()
                  if key_ in pyecharts.datasets.COORDINATES.keys() and value_['is_city']==1],
                 type_='heatmap',
                 symbol_size=3,
                 progressive=50)
            .set_series_opts(label_opts=opts.LabelOpts(is_show=False))
            .set_global_opts(
                title_opts=opts.TitleOpts(title="新型冠状病毒全国疫情热力图【自动轮播】",
                                         subtitle="更新日期:{}".format(update_date)),
                legend_opts=opts.LegendOpts(is_show=False),
                visualmap_opts=opts.VisualMapOpts(max_=50000, is_show=False,
                                                  is_piecewise=True,
                                                  pieces=[{"min": 50000},
                                                          {"min": 5000, "max": 50000},
                                                          {"min": 500, "max": 5000},
                                                          {"min": 10, "max": 500},
                                                          {"max": 10} ],
                                                  range_color=['blue', 'green', 'green', 'yellow', 'red']),
                graphic_opts=[opts.GraphicGroup(
                                                graphic_item=opts.GraphicItem(
                                                    rotation=JsCode("Math.PI / 4"),
                                                    bounding="raw",
                                                    right=110,
                                                    bottom=110,
                                                    z=100,
                                                ),
                                                children=[
                                                    opts.GraphicRect(
                                                        graphic_item=opts.GraphicItem(
                                                            left="center", top="center", z=100
                                                        ),
                                                        graphic_shape_opts=opts.GraphicShapeOpts(
                                                            width=400, height=50
                                                        ),
                                                        graphic_basicstyle_opts=opts.GraphicBasicStyleOpts(
                                                            fill="rgba(0,0,0,0.3)"
                                                        ),
                                                    ),
                                                    opts.GraphicText(
                                                        graphic_item=opts.GraphicItem(
                                                            left="center", top="center", z=100
                                                        ),
                                                        graphic_textstyle_opts=opts.GraphicTextStyleOpts(
                                                            text=day,
                                                            font="bold 26px Microsoft YaHei",
                                                            graphic_basicstyle_opts=opts.GraphicBasicStyleOpts(
                                                                fill="#fff"
                                                            ),
                                                        ),
                                                    ),
                                                ],
                                            )
                                ],
            )
    )

    tl.add(geo, day)##实现与时间相关

tl.render_notebook()
若有不足,请多多指教。


