Echarts各种图表案例(代码+效果)
阅读目录
- 一、编写模板
- 一、折线图
- 三、柱形图
- 四、叠加的柱形图
- 五、散点图
- 六、饼图
- 七、雷达图
- 八、中国地图
学习网站: Echarts官网
一、编写模板
从官网下载echarts.min.js文件
模板如下,以后编写echarts图表只需改变option里的内容就可以了
<html>
<head lang="en">
    <meta charset="utf-8">
    <title>EChartstitle>
    <style type="text/css">
        #main{height:400px;width: 1000px}
    style>
    <script src="echarts.min.js">script>
head>
<body>
<div id="main">div>
<script type="text/javascript">
    // 基于准备好的dom,初始化 echarts 实例并绘制图表。
    var myChart = echarts.init(document.getElementById("main"));
    // 指定图表的配置项和数据
    var option={};
    // 使用刚指定的配置项和数据显示图表
    myChart.setOption(option);
script>
body>
html>
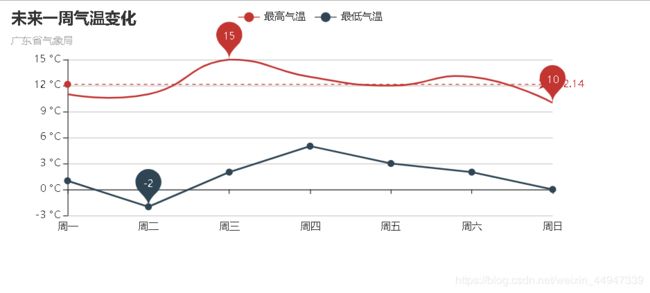
一、折线图
var option = {
        title : {
            text: '未来一周气温变化',
            subtext: '广东省气象局'
             },
        tooltip : {
            trigger: 'axis'// trigger 设置触发类型,默认数据触发,可选值:'item' ¦ 'axis'
        },
        legend: {
            // orient 设置布局方式,默认水平布局,可选值:'horizontal'(水平) ¦ 'vertical'(垂直)
            orient: 'horizontal',
            data:['最高气温','最低气温']
        },
        xAxis : [
            {
                type : 'category',//类目轴
                boundaryGap : false, // boundaryGap值为false的时候,折线第一个点在y轴上
                data : ['周一','周二','周三','周四','周五','周六','周日']
            }
        ],
        yAxis : [
            {
                type : 'value',//数值轴
                axisLabel : {
                    formatter: '{value} °C'
                }
            }
        ],
        series : [
            {
                name:'最高气温',
                type:'line',//图形类型
                symbolSize:8,// 设置折线上圆点大小
                symbol: 'none',// 设置小圆点消失,注意:设置symbol: 'none'以后,拐点不存在了,设置拐点上显示数值无效
                smooth: 0.5,// 设置折线弧度,取值:0-1之间
                data:[11, 11, 15, 13, 12, 13, 10],
                markPoint : {
                    data : [
                        {type : 'max', name: '最大值'},
                        {type : 'min', name: '最小值'}
                    ]
                },
                 markLine:{
                        data:[
                            {type:'average',name:'平均值'}
                        ]
                    }
            },
            {
                name:'最低气温',
                type:'line',
                symbol:'circle',// 设置拐点为实心圆
                symbolSize:8,// 设置折线上圆点大小
                data:[1, -2, 2, 5, 3, 2, 0],
                markPoint : {
                    data : [
                        {type : 'min', name: '周最低'}
                    ]
                }
            }
        ]
    };
三、柱形图
var option = {
        title : {
            text: '未来一周气温变化',
            subtext: '广东省气象局' },
        tooltip : {
            trigger: 'axis'},
        legend: {
            itemGap:40,
            data:['最高气温','最低气温']},
        calculable : true,
        xAxis : [{
                type : 'category',
                data : ['周一','周二','周三','周四','周五','周六','周日']}],
        yAxis : [{
                type : 'value',
                axisLabel : {
                    formatter: '{value} °C'}}],
        series : [
        	{
                name:'最高气温',
                type:'bar',
                data:[11, 11, 15, 13, 12, 13, 10],
                markPoint : {
                    data : [
                        {type : 'max', name: '最大值'},
                        {type : 'min', name: '最小值'}]}},
            {
                name:'最低气温',
                type:'bar',
                data:[1, 4, 2, 5, 3, 2, 0],
                markPoint : {
                    data : [
                        {type : 'min', name: '周最低'}]}
            }
        ]
    };
四、叠加的柱形图

只需要在前面柱形图代码的series添加 stack:‘1’(具体位置看如下代码)
  series : [{
                stack:'1',//叠起来
                name:'最高气温',
                type:'bar',
                data:[11, 11, 15, 13, 12, 13, 10],
                markPoint : {
                    data : [
                        {type : 'max', name: '最大值'},
                        {type : 'min', name: '最小值'}]}},
            {
                stack:'1',//叠起来
                name:'最低气温',
                type:'bar',
                data:[1, 4, 2, 5, 3, 2, 0],
                markPoint : {
                    data : [
                        {type : 'min', name: '周最低'}]}
            }
        ]
五、散点图
var option ={
            title:{
                text:'男女身高体重比例',
                subtext:'纯属虚构'
            },
            tooltip:{
                trigger:'axis',
                axisPointer:{
                    show:true,
                    type:'cross',
                    lineStyle:{
                        type:'dashed',
                        width:1
                    }
                }
            },
            legend:{
                data:['男生','女生']
            },
            xAxis:{
                type:'value',
                scale:true,//是否脱离0刻度,设置成 true 后坐标刻度不会强制包含零刻
                axisLabel:{
                    formatter:'{value}cm'
                }
            },
            yAxis:{
                type:'value',
                scale:true,
                axisLabel:{
                    formatter:'{value}kg'
                }
            },
            series:[
                {
                    name:'女生',
                    type:'scatter',
                    data: [
                        [161.2, 51.6], [167.5, 59.0], [159.5, 49.2], [157.0, 63.0], [155.8, 53.6],
                        [170.0, 59.0], [159.1, 47.6], [166.0, 69.8], [176.2, 66.8], [160.2, 75.2],
                        [172.5, 55.2], [170.9, 54.2], [172.9, 62.5], [153.4, 42.0], [160.0, 50.0],

                    ],
                    markPoint:{
                        data:[
                            {type:'max',name:'最大值'},
                            {type:'min',name:'最小值'}
                        ]},
                    markLine:{
                        data:[
                            {type:'average',name:'平均值'}
                        ]
                    }
                },
                {
                    name:'男生',
                    type:'scatter',
                    data: [
                        [174.0, 65.6], [175.3, 71.8], [193.5, 80.7], [186.5, 72.6], [187.2, 78.8],
                        [181.5, 74.8], [184.0, 86.4], [184.5, 78.4], [175.0, 62.0], [184.0, 81.6],
                        [180.0, 76.6], [177.8, 83.6], [192.0, 90.0], [176.0, 74.6], [174.0, 71.0]
                    ],
                    markPoint:{
                        data:[
                            {type:'max',name:'最大值'},
                            {type:'min',name:'最小值'}
                        ]},
                    markLine:{
                        data:[
                            {type:'average',name:'平均值'}
                        ]
                    }
                }
            ]
        };
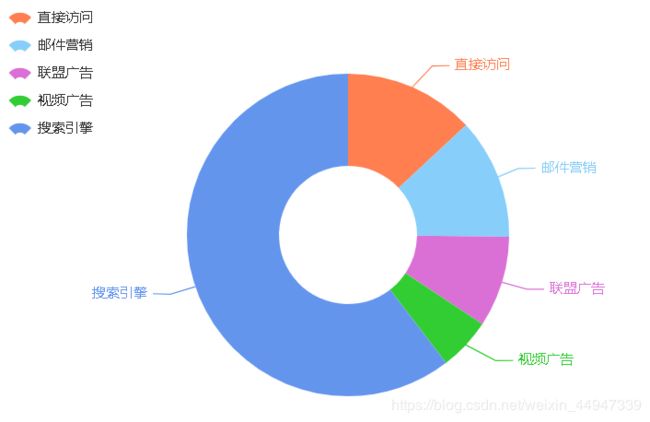
六、饼图
roseType:‘area’,//是否显示成南丁格尔图默认false
    var option = {
        tooltip: {
            trigger: 'item',// trigger 设置触发类型,默认数据触发,可选值:'item' ¦ 'axis'
            formatter: "{a}
{b}: {c} ({d}%)"// formatter设置提示框显示内容,
            // {a}指series.name,b}指series.data的name,
            // {c}指series.data的value  {d}%指这一部分占总数的百分比.
        },
        legend: {
            orient: 'vertical',
            x: 'left',
            data:['直接访问','邮件营销','联盟广告','视频广告','搜索引擎']
        },
        series: [
            {
                name:'访问来源',
                type:'pie',
//                roseType:'area',//是否显示成南丁格尔图默认false
                radius: ['30%', '70%'],// 设置环形饼状图, 第一个百分数设置内圈大小,第二个百分数设置外圈大小
                center: ['50%', '50%'], // 设置饼状图位置,第一个百分数调水平位置,第二个百分数调垂直位置

                data:[
                    {value:335, name:'直接访问'},
                    {value:310, name:'邮件营销'},
                    {value:234, name:'联盟广告'},
                    {value:135, name:'视频广告'},
                    {value:1548, name:'搜索引擎'}
                ]
            }
        ]
    };
    myChart.setOption(option);
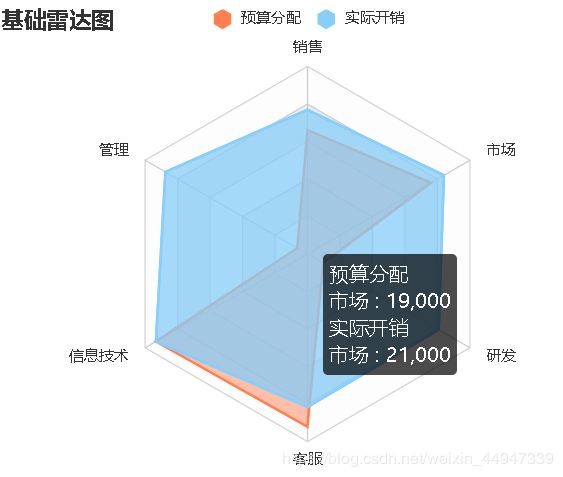
七、雷达图
    var option={
        title:{
            text:'基础雷达图'
        },
        tooltip:{
            trigger:'axis'
        },
        legend: {
            data: ['预算分配', '实际开销']
        },
        polar:[{
            indicator:[//雷达图的指示器,用来指定雷达图中的多个变量(维度),跟data中 value 对应
                    { text: '销售', max: 6500},// 指示器名称,指示器的最大值,可选,建议设置
                    { text: '管理', max: 16000},
                    { text: '信息技术', max: 30000},
                    { text: '客服', max: 38000},
                    { text: '研发', max: 52000},
                    { text: '市场', max: 25000}
                ]}],
        calculable:true,
        series:[
            {
                name:'预算 vs 开销',
                symbol: 'none',//去掉拐点的圈
                center: ['50%', '50%'],// 圆中心坐标,数组的第一项是横坐标,第二项是纵坐标。[ default: ['50%', '50%'] ]
                radius:160,// 圆的半径,数组的第一项是内半径,第二项是外半径。
                itemStyle:{normal:{areaStyle:{type:'default'}}},
                type:'radar',
                data:[
                    {value:[4300,1000,28000,35000,5000,19000], name:'预算分配'},
                    {value:[5000,14000,28000,31000,42000,21000], name:'实际开销'}
                    ]
        }]
    };
    myChart.setOption(option);
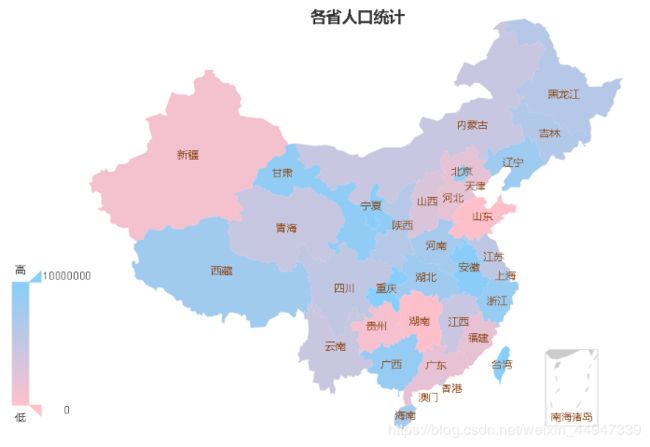
八、中国地图
var option={
       title:{
             text:'各省人口统计',
             x: 'center'
         },
         tooltip:{trigger:'item'},
        dataRange:{
             min:0,
            max:10000000,
            x:'left',
            y:'bottom',
            color:['lightskyblue','pink'],
            text:['高','低'],
            calculable:true
        },
         series:[{
              name:'人口',
              type:'map',//地图类型
              mapType:'china',//获取中国的地图
              itemStyle: {
                  normal: {label: {show: true}},//显示标签
                  emphasis: {//选中或者悬浮状态
                      label: {show: true}
                  }
              },
              data: [
                  {name: '北京', value: Math.round(Math.random() * 10000000)},
                  {name: '天津', value: Math.round(Math.random() * 10000000)},
                  {name: '河北', value: Math.round(Math.random() * 10000000)},
                  {name: '山西', value: Math.round(Math.random() * 10000000)},
                  {name: '内蒙古', value: Math.round(Math.random() * 10000000)},
                  {name: '辽宁', value: Math.round(Math.random() * 10000000)},
                  {name: '吉林', value: Math.round(Math.random() * 10000000)},
                  {name: '黑龙江', value: Math.round(Math.random() * 10000000)},
                  {name: '上海', value: Math.round(Math.random() * 10000000)},
                  {name: '江苏', value: Math.round(Math.random() * 10000000)},
                  {name: '浙江', value: Math.round(Math.random() * 10000000)},
                  {name: '安徽', value: Math.round(Math.random() * 10000000)},
                  {name: '福建', value: Math.round(Math.random() * 10000000)},
                  {name: '江西', value: Math.round(Math.random() * 10000000)},
                  {name: '山东', value: Math.round(Math.random() * 10000000)},
                  {name: '河南', value: Math.round(Math.random() * 10000000)},
                  {name: '湖北', value: Math.round(Math.random() * 10000000)},
                  {name: '湖南', value: Math.round(Math.random() * 10000000)},
                  {name: '广东', value: Math.round(Math.random() * 10000000)},
                  {name: '广西', value: Math.round(Math.random() * 10000000)},
                  {name: '海南', value: Math.round(Math.random() * 10000000)},
                  {name: '重庆', value: Math.round(Math.random() * 10000000)},
                  {name: '四川', value: Math.round(Math.random() * 10000000)},
                  {name: '贵州', value: Math.round(Math.random() * 10000000)},
                  {name: '云南', value: Math.round(Math.random() * 10000000)},
                  {name: '西藏', value: Math.round(Math.random() * 10000000)},
                  {name: '陕西', value: Math.round(Math.random() * 10000000)},
                  {name: '甘肃', value: Math.round(Math.random() * 10000000)},
                  {name: '青海', value: Math.round(Math.random() * 10000000)},
                  {name: '宁夏', value: Math.round(Math.random() * 10000000)},
                  {name: '新疆', value: Math.round(Math.random() * 10000000)},
                  {name: '台湾', value: Math.round(Math.random() * 10000000)},
                  {name: '香港', value: Math.round(Math.random() * 10000000)},
                  {name: '澳门', value: Math.round(Math.random() * 10000000)}
                  ]
              }
          ]
    };


