基于树莓派的蓝牙出勤信息收集系统
写了一个基于树莓派的蓝牙出勤信息收集系统,用于记录和监督自己的工作时长情况。
代码与安装指引:Github:树莓派蓝牙出勤信息收集系统
该系统使用树莓派扫描附近的蓝牙或蓝牙低功耗设备,以无感方式收集出勤信息。信息将被存储在InfluxDB中,并通过Grafana的Dashboard使数据可视化。
我使用APScheduler设置定时事件,往数据库中插入一个异常值,来触发Grafana的报警,向邮箱发送每日报告。
系统目前支持多个蓝牙设备(蓝牙或BLE)的同时扫描与记录,便于多人使用。多人使用时,需要在代码中增加对应的scheduler。
此系统还可为树莓派在其他物联网场景的应用提供支持。
欢迎star与fork。
【附安装指引】
RPi Bluetooth Attendance Information Collection System
This system helps collect attendance information in a non-inductive way by scanning the nearby Bluetooth or BLE device using Raspberry Pi.
The system stores information in InfluxDB and makes the information observable via Grafana.
The Daily report is also supported.
Installation
1. Clone the repository
cd ~
git clone https://github.com/forskamse/RPi-Bluetooth-Attendance-Information-Collection-System.git
2. System dependencies
[Hardware: Raspberry Pi 4 - 4G RAM Version]
[OS: Raspbian GNU/Linux 10 (buster)]
[HCI Tool: V5.50]
[Influx DB: V1.6.4]
wget -qO- https://repos.influxdata.com/influxdb.key | sudo apt-key add -
echo "deb https://repos.influxdata.com/debian buster stable" | sudo tee /etc/apt/sources.list.d/influxdb.list
sudo apt update
sudo apt install influxdb influxdb-client
[Grafana V6.6.0]
wget https://dl.grafana.com/oss/release/grafana_6.6.0_armhf.deb
sudo dpkg -i grafana_6.6.0_armhf.deb
[Grafana Rendering Plugin]
wget https://nodejs.org/dist/v12.16.0/node-v12.16.0-linux-armv7l.tar.xz
sudo ln -s /home/pi/Projects/node-v12.16.0-linux-armv7l/bin/node /usr/bin/node
sudo ln -s /home/pi/Projects/node-v12.16.0-linux-armv7l/bin/npm /usr/bin/npm
npm -g install yarn
npm -g install typescript
sudo ln -s /home/pi/Projects/node-v12.16.0-linux-armv7l/bin/tsc /usr/bin/tsc
sudo ln -s /home/pi/Projects/node-v12.16.0-linux-armv7l/bin/yarn /usr/bin/yarn
# You should change to root and run the following commands.
su root
cd /var/lib/grafana/plugins/
git clone https://github.com/grafana/grafana-image-renderer.git
cd grafana-image-renderer
make deps
make build
sudo apt install chromium-browser chromium-chromedriver
cd /var/lib/grafana/plugins/grafana-image-renderer/node_modules/puppeteer/.local-chromium/linux-706915/chrome-linux/    # here pls check whether your chrome version number is 706915 or not
mv chrome chrome.bak
cp /usr/bin/chromium-browser /var/lib/grafana/plugins/grafana-image-renderer/node_modules/puppeteer/.local-chromium/linux-706915/chrome-linux/chrome
cd ~
3. Python dependencies
Since BLE scanning requires system permission, using system python3 environment is highly recommended. Otherwise you might suffer from some issues on module searching when running the code with sudo permission.
sudo pip3 install influxdb apscheduler -i https://pypi.tuna.tsinghua.edu.cn/simple/
Configuration
1. Code modification
-
RPi-Bluetooth-Attendance-Information-Collection-System.py
On considering the security, just write [your_db_pwd] into a txt file.
Change [your_db_user].
Change target device names(targetDevName, data type: list) and target device addresses(targetDevAddrs, data type: list). You can put both ‘Bluetooth’ and ‘BLE’ device addresses in targetDevAddrs.
Set triggers individually for each target device name if necessary. As a reminder, you should check whether your machine time and local time are consistant.
-
start-when-power-on.sh
Change /path/to/your/Project.
2. InfluxDB configuration
sudo systemctl unmask influxdb.service
sudo systemctl enable influxdb
sudo systemctl start influxdb
Enter influxdb cli mode(by runing ‘influx’ on shell):
CREATE USER [your_db_user] WITH PASSWORD [your_db_pwd] WITH ALL PRIVILEGES
CREATE DATABASE attendanceInformation
3. Grafana configuration
## Start grafana-image-renderer server in the background
cd /var/lib/grafana/plugins/grafana-image-renderer/
nohup node build/app.js server --port=8081 &
## Edit grafana config file
sudo nano /etc/grafana/grafana.ini
#######################################
[smtp]
enabled = true
host = [your_email_smtp_host]
user = [your_email_address]
password = [your_email_passwd]
from_address = [your_email_address]
from_name = Grafana
;For example:
;[your_email_smtp_host]: smtp.qq.com:465
;[your_email_address]: [email protected]
[rendering]
server_url = http://localhost:8081/render
callback_url = http://localhost:3000/
#######################################
## Enable and start grafana server
sudo /bin/systemctl daemon-reload
sudo /bin/systemctl enable grafana-server
sudo systemctl start grafana-server
Run ‘hostname -I’ for [your_host_address].
Visit http://[your_host_address]:3000/.
Change admin password when first login with username as ‘admin’ and password as ‘admin’.
Create a dashbord and add data source InfluxDB with [your_db_user] and [your_db_pwd].
Set up query rules:
Some additional query settins help with data observability and default image rendering time range:
Set up alert rules:
‘Evaluate every’ determines the intervals when the rule is evaluated. ‘For’ determines the pending duration after the alert rule was triggered.
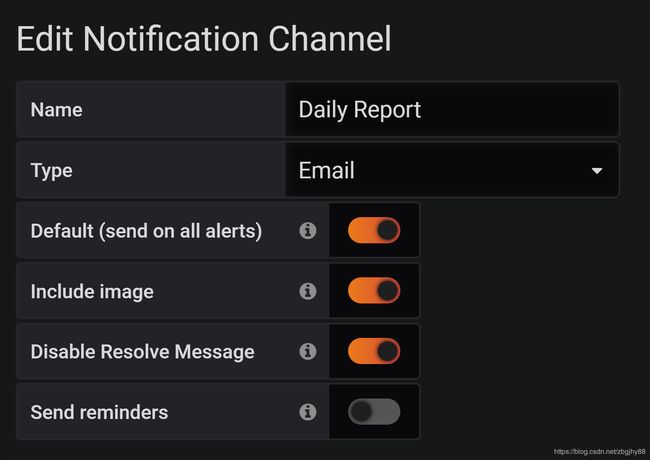
Set up notification channels:
Here ‘Include image’ determines whether to send a rendered image or not. ‘Disable Resolve Message’ prevents from sending another [OK] alerting email once the former alerting situation was resolved.
4. Boot from power on
## Add configuration before "exit 0"
sudo nano /etc/rc.local
########################################################
/bin/bash /path/to/your/Project/start-when-power-on.sh
########################################################
Running
cd /path/to/your/Project/
nohup sudo python3 RPi-Bluetooth-Attendance-Information-Collection-System.py >> RpiAttendance.log &
Reference
https://pimylifeup.com/raspberry-pi-grafana/
https://github.com/grafana/grafana-image-renderer/blob/master/docs/building_from_source.md
https://github.com/grafana/grafana-image-renderer/issues/7
https://grafana.com/docs/grafana/latest/administration/image_rendering/
https://community.openhab.org/t/tutorial-grafana-rendering-on-raspberry-pi/71777


