Java VisualVM
文章目录
- 1.Java VisualVM简介(Introduction to Java VisualVM)
- 1.1 Java VisualVM简介(Introduction to Java VisualVM)
- 1.2 启动Java VisualVM(Starting Java VisualVM)
- 1.2.1 Java VisualVM用户目录(Java VisualVM Userdir)
- 1.3 Java VisualVM 窗口(Java VisualVM Windows)
- 1.3.1 应用程序窗口(Applications Window)
- 1.3.2 主窗口(Main Window)
- 1.4 Java VisualVM插件(Java VisualVM Plugins)
- 1.4.1 安装Java VisualVM插件(To install a Java VisualVM plugin):
- 2 使用应用程序窗口(Using the Applications Window)
- 2.1 应用程序窗口节点(Applications Window Nodes)
- 2.1.1 本地节点(Local Node)
- 2.1.2 远程节点(Remote Node)
- 2.1.3 VM Coredumps
- 2.1.4 快照(Snapshots)
- 3 本地应用程序(Working with Local Applications)
- 3.1 查看应用程序数据(View Application Data)
- 3.2 获取线程Dump(Take a Thread Dump)
- 3.3 获取堆Dump(Take a Heap Dump)
- 3.4 Profile an Application
- 3.5 获取快照(Take Snapshots)
- 4 使用远程应用程序(Working with Remote Applications)
- 4.1 连接远程主机(Connection to a Remote Host)
- 4.2 查看应用程序数据(Viewing Application Data)
- 5 使用Coredumps(Working with Coredumps)
- 6 使用快照(Working with Snapshots)
- 6.1 快照类型(Snapshot Types)
- 6.1.2 Profiler快照(Profiler Snapshots)
- 6.1.2.1 获取Profiler快照(Taking Profiler Snapshots)
- 6.1.3 应用程序快照(Application Snapshots)
- 7 浏览堆Dump(Browsing a Heap Dump)
- 7.1 打开堆转储文件 (Opening a Heap Dump File)
- 7.2 获取堆转储文件 (Taking a Heap Dump)
- 7.3 浏览堆转储 (Browsing a Heap Dump)
- 7.3.2 摘要视图(Summary View)
- 7.3.3 类视图(Classes View)
- 7.3.4 实例视图(Instances View)
- 8 查看应用程序概述(Viewing Application Overview)
- 8.1 概述(Overview)
- 8.2 保存数据(Saved Data)
- 8.3 JVM软件参数(JVM Software Arguments)
- 8.4 系统属性(System Properties)
- 9 监控应用程序(Monitoring an Application)
- 9.1 监控应用程序
- 10 监控应用程序线程(Monitoring Application Threads)
- 10.1 监控线程活动(Monitoring Thread Activity)
- 10.1.1 时间轴选项卡(Timeline Tab)
- 10.1.2 明细选项卡(Details Tab)
- 10.3 获取线程Dump(Taking a Thread Dump)
- 11 显式地连接到JMX代理(Connecting to JMX Agents Explicitly)
- 11.1 何时需要显式JMX连接(When Are Explicit JMX Connections Necessary?)
- 11.2 建立显式JMX连接(Making an Explicit JMX Connection)
- 11.2.1 本地JMX连接(Local JMX Connections)
- 11.2.2 远程JMX连接(Remote JMX Connections)
- 11.3 关于JMX技术的进一步阅读(Further Reading About JMX Technology)
- 12 应用程序性能(Profiling Applications)
- 12.1 Profiling applications
- 12.1.1 使用工具栏(Using the toolbar)
- 12.1.2 过滤分析结果(Filtering profiling results)
- 12.1.3 修改分析设置(Modifying profiling settings)
- 12.2 CPU Profiling
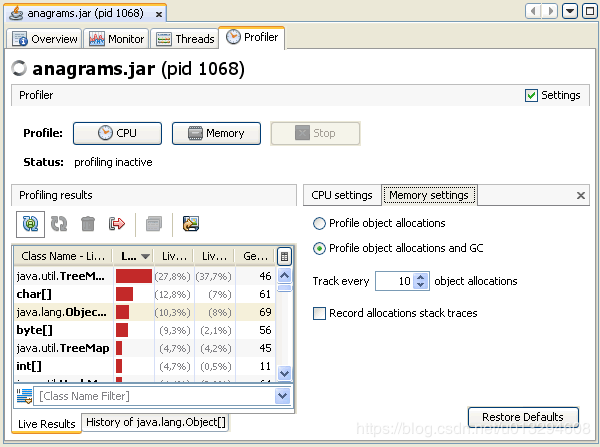
- 12.3 Memory Profiling
- 12.4 Taking Profiler Snapshots
源文档地址:https://docs.oracle.com/javase/8/docs/technotes/guides/visualvm/index.html
1.Java VisualVM简介(Introduction to Java VisualVM)
1.1 Java VisualVM简介(Introduction to Java VisualVM)
Java VisualVM is a tool that provides a visual interface for viewing detailed information about Java technology-based applications (Java applications) while they are running on a Java Virtual Machine (JVM). Java VisualVM organizes JVM data that is retrieved by the Java Development Kit (JDK) tools and presents the information in a way that enables you to quickly view data on multiple Java applications. You can view data on local applications and applications that are running on remote hosts. You can also capture data about the JVM software and save the data to your local system, and view the data later or share the data with others.
In order to benefit from all Java VisualVM’s features, you should run the Java Platform, Standard Edition (Java SE) version 6.
Java VisualVM是一个工具,它提供了一个可视化界面,用于查看基于Java技术的应用程序(Java应用程序)在Java虚拟机(JVM)上运行时的详细信息。Java VisualVM组织由Java Development Kit(JDK)工具检索到JVM数据,并以使您能够在多个Java应用程序上快速查看数据的方式显示信息。您可以查看本地应用程序和运行在远程主机上的应用程序上的数据。您还可以捕获关于JVM软件的数据并将数据保存到本地系统,稍后查看或与他人共享。
为了从Java VisualVM的所有特性中获益,您应该运行Java SE 6
1.2 启动Java VisualVM(Starting Java VisualVM)
Java VisualVM is bundled with JDK version 6 update 7 or greater. Once you have installed an appropriate JDK version, navigate to your JDK software’s bin directory and double-click the Java VisualVM executable. On Windows this directory will be the following:
Java VisualVM与JDK版本6 updated 7以及更高版本捆绑在一起。安装了合适的JDK版本后,导航到JDK软件的bin目录,双击Java VisualVM可执行文件。在Windows下,这个目录如下:
C:\Program Files\Java\jdk1.6.0_*update-number*\bin
Alternatively, navigate to your JDK software’s bin directory and type the following command at the command (shell) prompt:
或者,导航到JDK软件的bin目录,并在命令(shell)提示符下输入一下命令:
jvisualvm
The first time that you launch Java VisualVM you are prompted to accept a license agreement.
第一次启动Java VisualVM时,系统会提示您接受许可协议。
1.2.1 Java VisualVM用户目录(Java VisualVM Userdir)
On Windows, the default location for the Java VisualVM userdir is the following:
在Windows上,Java VisualVM的userdir的默认位置如下:
C:\Documents and Settings\**\Application Data\.visualvm\*JDK_update-number*
To find the location of your Java VisualVM userdir, choose Help > About from the main menu and click Details in the About Java VisualVM window.
要找到Java VisualVMuserdir的位置,请从主菜单中选择Help > About,然后单击About Java VisualVM窗口中的Details。
1.3 Java VisualVM 窗口(Java VisualVM Windows)
When you start Java VisualVM, the main Java VisualVM window opens. The main Java VisualVM window is divided into two windows.
当您启动Java VisualVM时,将打开Java VisualVM主窗口。这个Java VisualVM主窗口分为两个窗口。
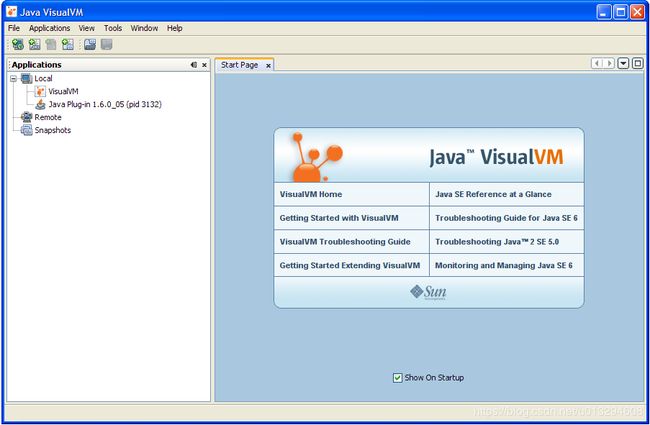
When you first start Java VisualVM, the Applications window is visible in the left side of the window and the Start Page is visible in the right side in the main window. The Start Page contains links to Java VisualVM documentation web pages and additional resources.
Note: The Start Page opens by default each time you start Java VisualVM. You can open the Start Page at any time by choosing Help > Start Page from the main menu. You can also hide the Start page by unchecking the “Show On Startup” check-box.
当您第一次启动Java VisualVM时,应用程序窗口在主窗口的左侧可见,而开始页面在主窗口的右侧可见。开始页面包含指向Java VisualVM文档的web页面和其他资源的连接。
注意: 每次启动Java VisualVM时,默认情况下都会打开开始页面,您可以在任何时候打开开始页面,从主菜单中选择Help > Start Page。您还可以通过取消选中“Show On StartUp”复选框来隐藏开始页面。
1.3.1 应用程序窗口(Applications Window)
The Applications window opens in the left side of the main Java VisualVM window when you launch the application. The Applications window is the main point of entry for exploring the details of running applications. The Applications window uses a tree structure to enable you to quickly view the applications running on the local machine and any connected remote machines. You can also access core dumps (Solaris/Linux) and saved snapshots from the Applications window.
Right-clicking a node in the Applications window opens a popup menu that enables you to perform actions related to that node, including opening application tabs, taking heap and thread dumps and opening snapshots in the main window.
For more details about how to use the Applications window to view and save data, see the following pages:
- Using the Applications Window
- Working with Local Applications
- Working with Remote Applications
- Working with VM Coredumps
- Working with Snapshots
启动应用程序时,应用程序窗口将在Java VisualVM的主窗口的左侧打开。应用程序窗口是研究正在运行的应用程序的详细信息的主要入口点。应用程序窗口使用树结构,使您能够快速查看在本地机器和任何连接的远程机器上运行的应用程序。您还可以访问core dump(Solaris/Linux)和从应用程序窗口保存的快照。
在应用程序窗口中,右键单击一个节点将打开一个弹出菜单,该菜单允许您执行与该节点相关的操作,包括在主窗口中打开应用程序选项卡,获取堆dump和线程dump以及打开快照。
有关如何使用应用程序窗口查看和保存数据的更多详细信息,请参见如下页面:
- 使用应用程序窗口
- 使用本地应用程序
- 使用远程应用程序
- 使用虚拟机Coredumps
- 使用快照
1.3.2 主窗口(Main Window)
Detailed information about applications is displayed in the main window. When you view data about an application, each application is represented by a tab in the main window that enables you to easily view and navigate the data. Saved thread dumps and heap dumps are also opened in the main window.
For information about the application data that can be displayed in the main window, see the following pages:
- Application Overview Tab
- Monitoring an Application in the Monitor Tab
- Monitoring Threads in the Threads Tab
- Browsing a Heap Dump
- Profiling an Application in the Profiler Tab (local applications only)
有关应用程序的详细信息显示在主窗口中。当您查看关于应用程序的数据时,每个应用程序都由主窗口中的一个选项卡表示,该选项卡使您能够方便地查看和导航数据。保存的线程dump和堆dump都会在主窗口中打开。
有关可在主窗口中显示的应用程序数据,请参见以下页面
- 应用程序概述选项卡
- 在监控选项卡中监控应用程序
- 在线程选项卡中监控线程
- 浏览堆Dump
- 在Profiler选项卡中分析应用程序性能(仅本地应用程序)
1.4 Java VisualVM插件(Java VisualVM Plugins)
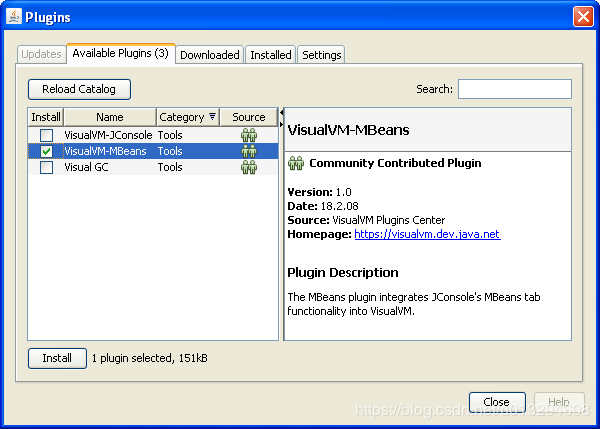
You can add functionality to Java VisualVM by using the Plugins manager to install plugins from the Java VisualVM Plugins Center. You can also extend the functionality of Java VisualVM by developing your own plugins that can then be added to an update center.
For example, installing the Java VisualVM-MBeans plugin adds an MBeans tab to the application tab that enables you to monitor and manage MBeans from within Java VisualVM.
通过使用插件管理器安装来自Java VisualVM插件中心的插件,您可以向Java VisualVM添加功能。您还可以通过开发自己的插件来扩展Java VisualVM的功能,然后可以将这些插件添加到更新中心。
例如,安装Java VisualVM-MBeans插件,可以向应用程序选项卡里添加了一个MBeans选项卡,通过此选项卡,可以在Java VisualVM内监控和管理MBeans
1.4.1 安装Java VisualVM插件(To install a Java VisualVM plugin):
-
Choose Tools > Plugins from the main menu.
-
In the Available Plugins tab, select the Install checkbox for the plugin. Click Install.
-
Step through and complete the plugin installer.
-
从主菜单中选择“工具” > “插件”。
-
在“可用插件”选项卡中,选中该插件的“安装”复选框。单击“安装”。
For more information about creating Java VisualVM plugins, see the following documents:
- Getting Started Extending Java VisualVM
有关创建Java VisualVM插件的更多信息,请参见以下文档
- 扩展Java VisualVM
2 使用应用程序窗口(Using the Applications Window)
When you start Java VisualVM, the Applications window is visible in the left side of the Java VisualVM window. The Applications window uses a tree structure to enable you to quickly view the applications that are running on local and connected remote JVM software instances. The Applications window also displays core dumps and application snapshots.
启动VisualVM后,“应用程序”窗口显示在VisualVM窗口的左侧。“应用程序”窗口使用树形结构,使您快速查看本地和远程JVM上运行的Java应用程序。“应用程序”窗口也能显示核心dumps和应用程序快照
2.1 应用程序窗口节点(Applications Window Nodes)
The Application window has nodes and sub-nodes that you can expand to view running applications and saved files. For most nodes in the Applications window, you can view additional information and perform actions by right-clicking a node and choosing an item from the popup menu. The actions available in the popup menu vary according to the node.
“应用程序”窗口中有节点和子节点,您可以展开它们来查看正在运行的应用程序和保存的文件。对于“应用程序”窗口中的大多数节点,可以通过右键单击一个节点并从弹出菜单中选择一个项来查看其他信息并执行操作。弹出菜单中可用的操作根据节点的不同而不同。
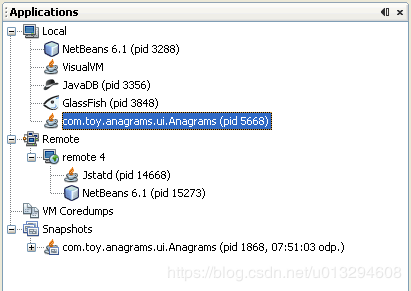
The Applications window has the following primary nodes:
“应用程序”窗口有以下主要节点
2.1.1 本地节点(Local Node)
The Local node displays the name and process IDs (PID) of Java applications that are running on the same system as Java VisualVM. When you launch Java VisualVM and expand the Local node, Java VisualVM automatically displays the currently running Java applications. Java VisualVM is always listed as one of the local applications. When a new local Java application is launched, a node for that application appears under the Local node. The application node disappears when the application terminates.
If you use Java VisualVM to take thread dumps, heap dumps or profiling snapshots of an application, they are displayed as sub-nodes below the node for that application. You can right-click a dump or snapshot sub-node to save it to your local system. You can collect and archive all the information collected about an application and save it as an application snapshot.
For more information about how to view data about local applications, see the following pages:
- Working with Local Applications
- Working with Snapshots
- Using the VisualVM Profiler
本地节点显示与VisualVM运行在同一系统上的Java应用程序的名称和进程id(PID)。当启动VisualVM并展开本地节点时,VisualVM将自动显示当前运行的Java应用程序。VisualVM始终被列为本地应用程序之一。当启动新的本地Java应用程序时,该应用程序的节点将显示在本地节点下。当应用程序之中时,该应用程序节点将消失。
如果使用VisualVM获取应用应用程序的线程dumps、堆dumps或分析快照,它们将以子节点形式显示在该应用程序节点下面。您可以右键单击转储或者快照子节点,将其保持到本地文件系统。您可以收集和存档有关应用程序的所有消息,并将其保存为应用程序快照
有关如何查看本地应用程序相关数据的更多详细信息,请参见以下页面:
- 使用本地应用程序
- 使用快照
- 使用VisualVM性能分析
2.1.2 远程节点(Remote Node)
When Java VisualVM connects to a remote host, the remote host is listed as a node under the Remote node. When connected to a remote host, you can expand the node for the remote host to see the Java applications that are running on that host. When a Java application is launched on the remote host, a node for that application is displayed under the remote host node.
You need to explicitly add the location of remote hosts if you want Java VisualVM to be able to connect to the host. Once a remote host is added, Java VisualVM persists the address of the remote host and will make a connection to the host each time Java VisualVM is started. If you do not want Java VisualVM to connect to the host on startup, you should right-click the remote host node and choose Remove before quitting Java VisualVM.
Note: To retrieve and display information on applications running on the remote host, the jstatd utility needs to be running on the remote host. To start the utility, type jstatd on the command line. The jstatd utility is included as part of Java Development Kit (JDK) version 6.
For more information about how to view data about remote applications, see the following pages:
- Working with Remote Applications.
- The
jstatdman page for Solaris, Linux, or Mac OS X or Windows.
当VisualVM连接到远程主机时,远程主机将被列为远程节点下的一个节点。当连接远程主机时,可以展开远程主机的节点,以查看在该主机上运行的Java应用程序。当在远程主机上启动Java应用程序时,改应用程序的节点将显示在远程主机节点下。
如果希望VisualVM能够连接到主机,则需要显式地添加远程主机的位置。添加远程主机后,VisualVM将保存远程主机的地址,并在每次启动VisualVM时与主机建立连接。如果不希望VisualVM在启动时连接到主机,则应该右键单击远程主机节点,并在退出VisualVM之前选择“删除”。
注意: 要检索和显示在远程主机上运行的应用程序的信息,需要在远程主机上运行jstatd。要启动jstatd,请在命令行上键入jstatd。在jdk6之后都包含jstatd。
有关如何查看远程应用相关数据的更多详细信息,请参见以下页面:
-
使用远程应用程序
-
用于Solaris,Linux或Mac OS X或Windows的jstatd手册页
2.1.3 VM Coredumps
The VM Coredumps node lists open core dump binary files when you open the files in Java VisualVM. A core dump is a binary file that contains information about the runtime status of the machine at the time the core dump was taken. If you have a core dump you can then extract an overview of the system properties, a heap dump and a thread dump.
Note: The Core Dump node is only visible if Java VisualVM is running on Solaris or Linux.
For more information, see the following document:
- Working with Core Dumps
当您在VisualVM中打开文件时, VM Coredumps节点列出打开的核心转储二进制文件。核心转储是一个二进制文件,其中包含有关在获取核心转储时计算机运行时状态的信息。如果你有一个核心转储,那么您可以提取系统属性的概述、堆dump和线程dump。
注意:只有在Solaris或Linux上运行VisualVM时,Core Dump节点才可见。
有关更多信息,请参见以下页面:
- 使用Core Dumps
2.1.4 快照(Snapshots)
The Snapshots node lists any application snapshots that are saved in the Java VisualVM userdir until they are explicitly deleted. An application snapshot captures the collected heap dumps, thread dumps and profiler snapshots of an application at the moment the snapshot is taken. You can expand the application snapshot node to see the data collected in the snapshot.
You can right-click an application snapshot node or any of the items listed under the node to open a popup menu enabling you to open, save, delete and rename the selected item.
For more information about taking and saving snapshots, see the following document:
- Working with Snapshots
快照节点列出了保存在VisualVM用户目录中的所有应用程序快照,直到显式删除它们为止。应用程序快照在拍摄快照时捕获收集到应用程序的堆dumps,线程dumps和性能分析快照。可以展开应用程序快照节点以查看快照中收集的数据。
您可以右键单击应用程序快照节点或该节点下列出的任何项,以打开弹出菜单,使您能够打开、保存、删除和重命名所选的项。
有关拍摄和保存快照的更多信息,请参见以下页面:
- 使用快照
3 本地应用程序(Working with Local Applications)
When you start Java VisualVM, a node for each local Java application is displayed under the Local node in the Applications window. You can expand an application node to see the profiler snapshots, thread dumps and heap dumps of the application. Right-clicking an application node or sub-node invokes a popup menu enabling you to choose various actions.
Note: The list of local applications always includes Java VisualVM.
启动VisualVM时,应用程序窗口中的本地节点下显示每个本地Java应用程序的节点。您可以展开应用程序节点,来查看应用程序的profiler快照、线程dump和堆dump。右键单击应用程序节点或子节点将调用弹出菜单,使您能够选择各种操作。
注意: 本地应用程序列表总是包含在VisualVM中
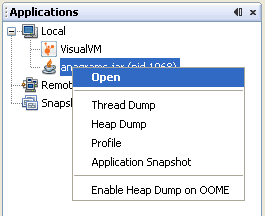
A local application node generally has the following items available in the popup menu.
- Open. Opens the tab for the application in the main window where you can view application data.
- Thread Dump. Takes a thread dump for the application.
- Heap Dump. Takes a heap dump for the application.
- Profile. Opens the Profiler sub-tab for the application where you can choose to profile the application. (Note that even though Java VisualVM appears in the application tree, Java VisualVM cannot profile itself).
- Profiler Snapshot. Creates a snapshot of the results from the profiling session. The snapshot opens in the main window and a node for the snapshot appears under the application node. This command is only available when Java VisualVM is profiling the application.
- Application Snapshot. Creates an application snapshot containing all application dumps and snapshots. A node for the application snapshot appears under the Snapshots node.
- Enable Heap Dump on OOME. Select this if you want Java VisualVM to automatically take a heap dump when the application encounters an OutOfMemoryException.
You can perform the following tasks directly from the popup menu.
本地应用程序节点的弹出菜单中通常有以下可用项:
- Open. 在主窗口中打开应用程序的标签,你可以在其中查看应用程序数据。
- Thread Dump. 获取应用程序的线程Dump
- Heap Dump. 获取应用程序的堆Dump
- Profile. 打开应用程序的Profiler子选项卡,您可以选择在其中配置应用程序。(注意。即使VisualVM出现在应用程序树中,VisualVM也不能配置自己)。
- Profiler Snapshot. 创建分析会话的结果快照。快照在主窗口中打开,快照的节点出现在应用程序节点下。此命令仅在VisualVM分析应用程序时可用。
- Application Snapshot. 创建包含所有应用程序dump和快照的应用程序快照。应用程序快照节点出现在快照节点下。
- Enable Heap Dump on OOME. 如果希望VisualVM在应用程序遇到OutOfMemoryExcption时自动执行堆转储,请选择此选项。
您可以直接从弹出菜单中执行以下任务。
3.1 查看应用程序数据(View Application Data)
Java VisualVM displays data about each running local application in a dedicated tab in the main window. Each application tab has sub-tabs where information about that application is displayed.
To open the application tab, right-click the application node in the Applications window and choose Open. (Alternatively, double-click the application node.) When you click Open, the Overview tab of the application tab opens in the main window.
The application tab for a local application has the following sub-tabs:
- Overview. For more, see Viewing Application Overview
- Monitor. For more, see Monitoring an Application
- Threads. For more, see Monitoring Application Threads
- Profiler. For more, see Profiling Applications
Additional tabs and sub-tabs may be visible depending on the installed plugins.
VisualVM在主窗口的一个专用标签中显示每个正在运行的本地应用程序的数据。每个应用程序标签都有子标签,其中显示有关该应用程序的信息。
要开发应用程序标签,右键单击“应用程序”窗口中的应用程序节点,然后选择“打开”。(或者,双击应用程序节点。)当您单击Open时,“应用程序”标签的概述标签将在主窗口中打开。
本地应用程序的应用程序标签有以下子标签。
- Overview. 更多信息请查看查看应用程序概述
- Monitor. 更多信息请查看监控应用程序
- Threads. 更多信息请查看监控应用程序线程
- Profiler. 更多信息请查看Profiling Applications
附加的标签和子标签是可见的,这取决于所安装的插件。
3.2 获取线程Dump(Take a Thread Dump)
You can use Java VisualVM to take a thread dump to capture information about the active application threads at the time you take the thread dump. When you take a thread dump, the thread dump opens in a sub-tab of the application in the main window. A node for the thread dump appears under the application node in the Applications window.
You can take a thread dump in the following ways:
- Right-click the application node in the Applications window and choose Thread Dump.
- Click the Thread Dump button in the Threads tab of the application tab.
When you take a thread dump, the thread dump opens in a sub-tab of the application in the main window. A node for the thread dump appears under the application node.
For more about working with application threads, see the following document:
- Monitoring Application Threads
在您获取线程dump时,可以使用VisualVM获取有关活动应用程序线程的信息。当您获取线程dump时,将在主窗口中的应用程序子标签中打开线程dump。线程dump的节点将出现在“应用程序”窗口的“应用程序”节点下。
可以通过以下方式获取线程dump:
- 在“应用程序”窗口中右键单击应用程序节点,然后选择“线程dump”
- 在“应用程序”标签的“线程”标签中单击“线程dump”按钮。
当您执行线程dump时,将在主窗口中的应用程序子标签中打开线程dump。应用程序节点下出现线程dump的节点。
有关使用应用程序线程的更多详细信息,请参见以下文档:
- 监控应用程序线程
3.3 获取堆Dump(Take a Heap Dump)
You can take a heap dump of a local application to capture a snapshot of the objects on the heap.
You can take a heap dump in the following ways:
- Right-click the application node in the Applications window and choose Heap Dump.
- Click the Heap Dump button in the Monitor tab of the application tab.
When you take a heap dump, the heap dump opens in a sub-tab of the application in the main window. A node for the heap dump appears under the application node.
For more about working with the heap, see the following document:
- Browsing a Heap Dump
您可以获取本地应用程序的堆Dump来捕获堆上对象的快照。
可以通过以下方式进行堆Dump:
- 在“应用程序”窗口中右键单击应用程序节点,然后选择“堆dump”
- 在“应用程序”标签的“监视器”标签中单击“堆dump”按钮。
当您进行堆dump时,堆dump将在主窗口中应用程序的子标签中打开。堆dump节点将出现在应用程序节点下。
有关更多使用堆的详细信息,请参见以下文档
- 浏览堆Dump
3.4 Profile an Application
Java VisualVM includes a profiler that enables you to analyze the performance and memory usage of a local application. You can profile an application without restarting it. To start a profiling session, right-click the application node and choosing Profile from the popup menu to open the profiling tab.
Note: Java VisualVM cannot be used to Profile itself.
For more see the following document:
- Profiling Applications
VisualVM包含一个Profiler,它使您能够分析本地应用程序的性能和内存使用情况。您可以在不重启应用程序的情况下对其进行分析。要启动分析会话,右键单击“应用程序”节点从弹出菜单中选择Profile以打开profiling选项卡。
**注意:**VisualVM不能用于Profile本身。
更多内容,请参见以下文档
- Profiling Application
3.5 获取快照(Take Snapshots)
Java VisualVM enables you to take snapshots that capture application data at the time the snapshot is taken. You can save snapshots to your local system and then examine them later or send them to others.
Java VisualVM enables you to take the following types of snapshots:
- Profiler snapshots. A profiler snapshot captures the profiling data at the moment the snapshot is takes. The snapshot is either a memory snapshot or a CPU snapshot. You can take a profiler snapshot only when you are profiling an application.
- Application snapshots. An application snapshot is an archive that contains all the heap dumps, thread dumps and snapshots that are listed below the application node.
For more see the following document:
- Working with Snapshots
Visual使您能够捕获快照,这些快照捕获快照时的应用程序数据。您可以将快照保存到本地文件系统,然后稍后对其进行检查或将发送给其他用户。
VisualVM允许您拍摄以下类型的快照:
- **Profiler 快照. ** Profiler快照在拍摄快照时捕获分析数据。快照是内存快照或CPU快照。只有在分析应用程序时才可以执行Profiler快照。
- 应用程序的快照. 应用程序快照是一个存档文件,包括应用程序节点下面列出的所有堆dump,线程dump和快照。
更多内容,请参见以下文档
- 使用快照
4 使用远程应用程序(Working with Remote Applications)
Java VisualVM is able to access and display data about applications running on remote hosts. After connecting to a remote host, Java VisualVM can display general data about the application’s runtime environment and can monitor memory heap and thread activity.
Note. Java VisualVM can retrieve monitoring information on remote applications but it cannot profile remote applications.
VisualVM能够访问和显示,运行在远程主机上的应用程序的数据。连接远程主机后,VisualVM可以显示关于应用程序运行时环境的一般数据,并可以监视堆内存和线程活动。
注意. VisualVM可以检索远程应用程序上的监视信息,但不能配置远程应用程序。
4.1 连接远程主机(Connection to a Remote Host)
Connected remote hosts are displayed as nodes under the Remote node in the Applications window. When you are connected to a remote host, Java VisualVM displays applications running on the host as sub-nodes, and automatically updates the status of the remote applications, removing the applications when they stop and adding applications when they start.
To add a remote host, right-click the Remote node in the Applications window, choose Add Remote Host and type the host name or IP address in the Add Remote Host dialog box. (You can also specify a display name that will be used to refer to the host when listed under the Remote node.)
在“应用程序”窗口中,已连接的远程主机显示在远程节点下的节点。当您连接远程主机时,VisualVM将在主机上运行的应用程序显示为子节点,并自动更新远程应用程序的状态,在它们停止时删除应用程序,在它们启动时添加应用程序。
要添加远程主机,在“应用程序”窗口中,右键单击远程节点,选择“添加远程主机”,并在“添加远程主机”对话框中键入主机名或IP地址。(您还可以指定一个显示名称,当在远程节点下列出时,该名称将用于引用主机。)
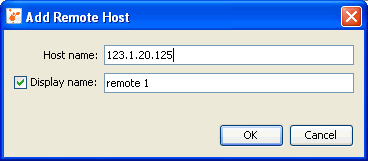
Note: To retrieve and display information on applications running on the remote host, the jstatd utility needs to be running on the remote host. To start the jstatd utility, type jstatd on the command line. The jstatd utility is included as part of Java Development Kit (JDK) version 6. For more on jstatd,see the man page for Solaris, Linux, or Mac OS X or Windows.
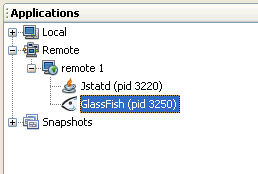
When Java VisualVM is connected to a remote host, a node for the remote host appears under the Remote node in the Applications window. You can expand the remote host node to view the applications running on the remote host.
注意: 要检索和显示在远程主机上运行的应用程序的信息,jstatd实用程序需要在远程主机上运行。要启动jstatd实用程序,请在命令行上输入jstatd。jstatd实用程序包含在jdk 6中,请参阅Solaris、Linux、Mac OS X或Windows的手册页。
当VisualVM连接到远程主机时,应用程序窗口中的远程节点下将出现远程主机的节点。您可以展开远程主机节点来查看在远程主机上运行的应用程序。
4.2 查看应用程序数据(Viewing Application Data)
Java VisualVM displays data about each running remote application in a dedicated tab in the main window. To open the application tab, right-click the application node in the Applications window and choose Open. (Alternatively, you can double-click the application node.) When you click Open, the Overview tab of the application tab opens in the main window.
VisualVM在主窗口的一个专用标签中显示每个正在运行的远程应用程序的数据。要打开应用程序标签,在“应用程序”窗口中,右键单击应用程序节点,然后选择“打开”。(或者,您可以双击应用程序节点。)当您单击打开是,应用程序标签的概述标签将在主窗口中打开。
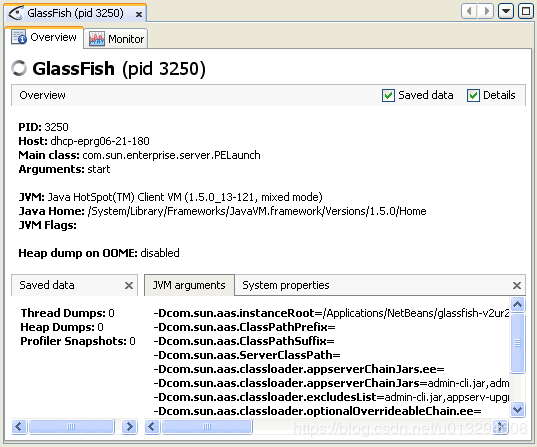
You can use the sub-tabs in the application tab to view details about the application.
For more see the following documents:
- Viewing Application Overview
- Monitoring an Application
- Monitoring Application Threads
- Connecting to JMX Agents Explicitly
您可以使用应用程序标签中的子标签查看有关应用程序的详细信息。
更多的详细信息,请参见以下文档:
- 查看应用程序概述
- 监控应用程序
- 监控应用程序线程
- 显式地连接到JMX代理
5 使用Coredumps(Working with Coredumps)
When you start Java VisualVM, the Applications window is visible in the left of the Java VisualVM window. The Applications window enables you to quickly view running local and remote applications. The Applications also displays core dumps and profiling snapshots saved to your local system.
启动Java VisualVM时,“Java应用程序”窗口将显示在Java VisualVM窗口的左侧。“应用程序”窗口使您可以快速查看运行的本地和远程应用程序。应用程序窗口还显示保存到本地系统的coredump和性能分析快照。
The Core Dump node is visible in the Applications window if Java VisualVM is running on Solaris or Linux. Generally, Java VisualVM can only open a core dump if the core dump was taken on the same machine. A core dump contains informaton on the Java Development Kit (JDK) and kernel of the machine where the core dump was taken. To open the core dump in Java VisualVM, this information must match the JDK software and kernel of the local system.
如果Java VisualVM在Solaris或Linux上运行,则CoreDump节点在“应用程序”窗口中可见。通常,Java VisualVM只能在CoreDump在同一台机器上执行的情况下打开CoreDump。CoreDump是在同一台计算机上进行的,则Java VisualVM只能打开核心转储。core dump包含Java Development Kit(JDK)和执行core dump的机器内核的信息。要在Java VisualVM中打开core dump,这些信息必须匹配JDK软件和本地系统的内核。
A core dump is a binary file capturing the entire heap contents at the moment the dump is captured. When you load a core dump in Java VisualVM, a node for the core dump appears below the Core Dump node.
CoreDump是在捕获转储时捕获整个堆内容的二进制文件。在Java VisualVM中加载核心转储时,核心转储的节点将显示在Core Dump节点下方。
To view an overview of the core dump, right-click the core dump node and choose Open. (Alternatively, double-click the node.)
要查看核心转储的概述,请右键单击核心转储节点,然后选择“打开”。(或者,双击节点。)
You can right-click the core dump node and choose Heap Dump or Thread Dump to view the heap dump and thread dump from the core dump.
您可以右键单击核心转储节点,然后选择堆转储或线程转储以查看核心转储中的堆转储和线程转储。
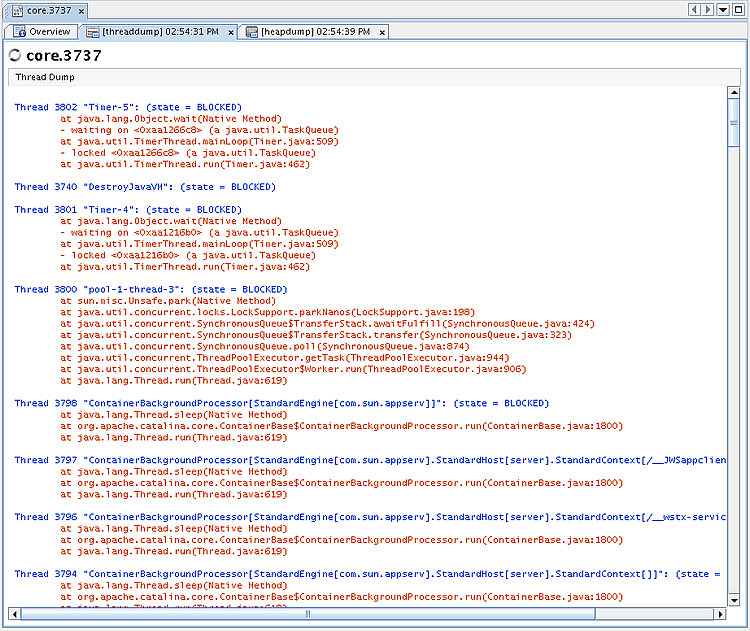
You can then save the thread dump and heap dump to your local system.
然后,您可以将线程转储和堆转储保存到本地系统。
6 使用快照(Working with Snapshots)
Java VisualVM enables you to take snapshots of application data and save the snapshots to your local system. Snapshots are a convenient way to capture data about an application because after a snapshot is saved it can be opened and viewed at any time. The target application does not need to be running to view the snapshot. Snapshots can also be sent and viewed by other people.
VisualVM允许您对应用程序数据进行快照,并将快照保存到本地系统。快照是捕获应用成熟数据的一种方便方法,因为在保存快照之后,可以随时打开和查看快照。目标应用程序不需要运行才能查看快照。快照也可以发送给其他人查看。
6.1 快照类型(Snapshot Types)
Snapshots are basically archives of data captured at a point in time that can then be opened in Java VisualVM. You can take and save the following types of snapshots:
快照基本上是在某个时间点捕获的数据存档,然后可以在VisualVM中打开这些数据。您可以拍摄和保存以下类型的快照:
6.1.2 Profiler快照(Profiler Snapshots)
Profiler snapshots capture profiling data at the moment the snapshot is taken. You can take a profiler snapshot at any time during a profiling session. When you take a profiler snapshot, a node representing the snapshot appears below the application node in the Applications window and a temporary snapshot file is written to your local system in the Java VisualVM userdir.
Java VisualVM can take the following types of profiler snapshots
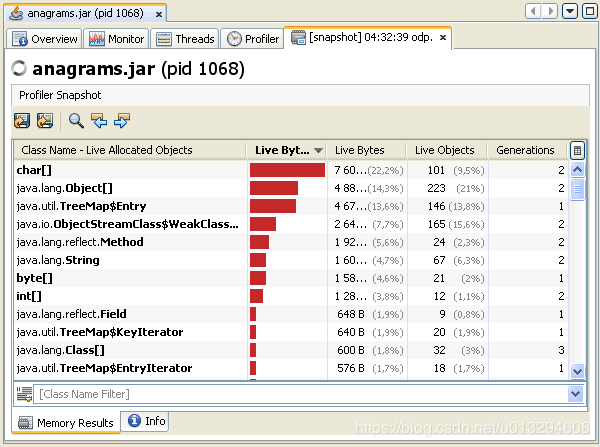
- Memory Snapshot. A memory snapshot captures profiling data on allocated objects. You can take a memory snapshot when you are using the profiler to analyze memory usage.
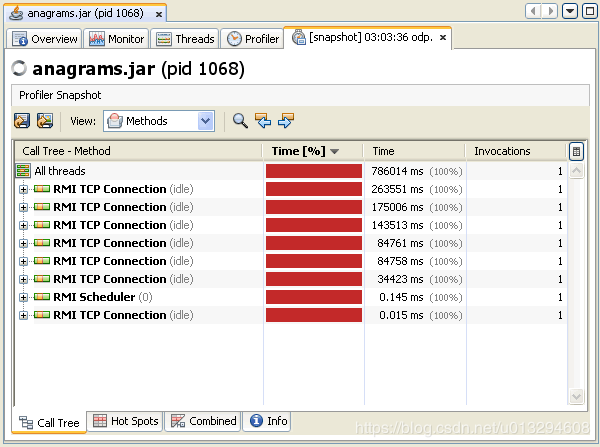
- CPU Snapshot. A CPU snapshot captures data on the performance of the application. You can take a CPU snapshot when you are using the profiler to analyze application performance.
Screenshot of memory profiling snapshot
Profiler快照捕获拍摄快照时的分析数据。您可以在分析会话期间的任何时候获取profiler快照。当您获取profiler快照时,表示快照的节点将出现在应用程序窗口的应用程序节点下方,并在VisualVM用户目录中将临时快照文件写入本地系统。
VisualVM可以获取一下类型的Profiler快照:
- Memory 快照. 内存快照捕获分配对象上的分析数据。在使用profiler分析内存使用情况时,可以捕获内存快照。
- CPU 快照. CPU快照捕获关于应用程序性能的数据。在使用Profile热分析应用程序性能时获取CPU快照。
Screenshot of CPU profiling snapshot
CPU分析快照的屏幕截图

If you want to view a profiler snapshot later, the snapshot must be explicitly saved to your local system, either as a profiler snapshot or archived in an application snapshot.
如果您希望稍后查看profiler快照,则必须显式地将快照保存到本地系统,或者作为profiler快照保存或者存档到应用程序快照中。
6.1.2.1 获取Profiler快照(Taking Profiler Snapshots)
You can take a profiler snapshot during a profiling session. When you take a memory or CPU snapshot, the snapshot opens in the application’s tab in the main window.
To take a snapshot, do one of the following:
- Click the Take Snapshot of Collected Results button in the Profiler tab
- Right-click the application node and choose Profiler Snapshot.
The snapshot toolbar enables you to do the following:
- Save Snapshot to Custom File. Click to save snapshot as Snapshot file (
.npsto your local system). - Save Current View to Image. Click to save snapshot as an image (
.pngto your local system) - Find in Results. Click to find a search term in the profiling results.
- Find Next Occurence. Click to find next occurrence of search term
- Find Previous Occurence. Click to find previous occurrence of search term
您可以在分析会话期间获取profiler快照。当您获取内存或CPU快照时,快照将在主窗口的应用程序标签中打开。
要拍摄快照,请执行以下步骤之一:
- 单击Profiler标签中的“收集结果快照”按钮
- 右键单击应用程序节点并选择Profiler 快照
快照工具栏可以让你做以下事情:
- 保存快照到自定义文件. 点击此处可将快照保存为快照文件(.nps本地系统)
- 将当前视图保存为图像. 单击此处将快照保存为图像(.png本地系统)
- 在结果集中查找. 单击此处可在分析结果中找到搜索项。
- 查找下一个发生. 单击此处可找到搜索项的下一个出现项
- 查找上一个发生. 单击此处可找到搜索项的上一个出现项
6.1.3 应用程序快照(Application Snapshots)
An application snapshot captures the collected heap dumps, thread dumps and profiler snapshots of an application at the moment the snapshot is taken. An application snapshot also captures general information about the Java Virtual Machine (JVM).
You take an application snapshot by right-clicking an application node in the Applications window and choosing Application Snapshot from the popup menu. Application snapshots are persisted between Java VisualVM sessions.
When you take an application snapshot:
- An application snapshot node appears under the Snapshots node in the Applications window
- Application data is saved in a folder in the the
repository/snapshotsfolder in the Java VisualVM user dir
Application snapshots are listed under the Snapshots node in the Applications window. Expand the application snapshot node to view the contents of the snapshot.
应用程序快照捕获拍摄快照时收集到的堆dump、线程dump和profiler快照。应用程序快照还捕获关于Java虚拟机(JVM)的一般信息。
在“应用程序”窗口中,右键单击应用程序节点,并从弹出菜单中选择“应用程序快照”,可以获取应用程序快照。应用程序快照在VisualVM会话之间持久化。
当您拍摄应用程序快照时:
- 应用程序快照节点将出现在“应用程序”窗口的快照节点下
- 应用程序数据保存在VisualVM用户目录的
repository/snapshots文件夹中的一个文件夹中
应用程序快照列在“应用程序”窗口的快照节点下。展开应用程序快照节点以查看快照的内容。
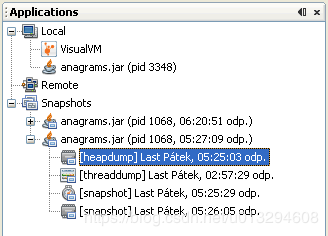
After you take an application snapshot, you can view and modify the contents by expanding the application snapshot node in the Applications window. You can right-click an application snapshot node or any of the items listed under the application snapshot node to open the popup menu where you can choose to open, save, rename and delete the item. You can then save the application snapshot as a single application snapshot archive (.apps) to your local system.
The Overview tab of an application snapshot captures data about the JVM software.
获取应用程序快照之后,可以通过在“应用程序”窗口中展开“应用程序快照”节点来查看和修改内容。您可以右键单击应用程序快照节点或应用程序快照节点下列出的任何项,以打开弹出菜单,在其中可以选择打开、保存、重命名和删除项。然后,您可以将应用程序快照作为单个应用程序快照存档(.apps)保存到本地系统。
7 浏览堆Dump(Browsing a Heap Dump)
You can use Java VisualVM to browse the contents of a heap dump file and quickly see the allocated objects in the heap. Heap dumps are displayed in the heap dump sub-tab in the main window. You can open binary format heap dump files (.hprof) saved on your local system or use Java VisualVM to take heap dumps of running applications.
A heap dump is a snapshot of all the objects in the Java Virtual Machine (JVM) heap at a certain point in time. The JVM software allocates memory for objects from the heap for all class instances and arrays. The garbage collector reclaims the heap memory when an object is no longer needed and there are no references to the object. By examining the heap you can locate where objects are created and find the references to those objects in the source. If the JVM software is failing to remove unneeded objects from the heap, Java VisualVM can help you locate the nearest garbage collecting root for the object.
您可以使用VisualVM浏览堆转储文件的内容 并快速查看堆中分配的对象. 堆转储显示在主窗口的heap dump子选项卡中. 您可以打开保存在本地的二进制文件(.hprof)或使用VisualVM获取正在运行应用的堆转储.
堆转储是某一时间JVM堆中所有对象的快照. JVM为堆中所有的类实例对象和数组对象分配内存. 当某一对象不再被需要或没有引用指向时,垃圾收集器(GC)将回收其堆内存. 您可以通过检查堆来找到对象创建的位置并在source中查找对象的引用. 如果JVM无法从堆中删除不需要的对象(删除失败), JavaI VisualVM 能帮助您定位对象最近的垃圾收集根(garbage collecting root).
7.1 打开堆转储文件 (Opening a Heap Dump File)
If you have a heap dump file saved on your local system, you can open the file in Java VisualVM by choosing File > Load from the main menu. Java VisualVM can open heap dumps saved in the .hprof file format. When you open a saved heap dump, the heap dump opens as a tab in the main window.
如果您本地保存了堆转储文件, 则可以通过在 Java VisualVM 的主菜单中选择 File > Load来打开该文件. Java VisualVM 能打开.hprof格式的文件. 打开已保存的堆转储时, 堆转储将作为主窗口中的选项卡打开.
7.2 获取堆转储文件 (Taking a Heap Dump)
You can use Java VisualVM to take a heap dump of a local running application. When you use Java VisualVM to take a heap dump, the file is only temporary until you explicitly save it. If you do not save the file, the file will be deleted when the application terminates.
You can take a heap dump by doing either of the following:
- Right-click the application in the Applications window and choose Heap Dump.
- Click Heap Dump in the Monitor tab of the application.
Heap dumps for a local application open as sub-tabs in the application’s tab. The heap dump also appears as a time-stamped heap dump node under the application node in the Applications window. To save a heap dump to your local system, right-click the heap dump in the Applications window and choose Save As.
您可以使用Java VisualVM来获取本地正在运行的应用的堆转储. 当您使用Java VisualVM获取堆转储信息时, 该文件只是临时的, 直到您保存它. 如果不保存文件, 文件将会在应用终止时被删除.
您可以通过执行以下任一操作来获取堆转储信息:
- 在应用程序窗口中右键单击该应用程序, 然后选择Heap Dump.
- 单击应用程序的监视器选项卡(Monitor)中的Heap Dump。
本地应用的堆转储作为应用程序选项卡中的子选项卡打开. 堆转储同时还会在应用程序(Applications)窗口的应用程序节点下显示为带时间戳的堆转储节点. 要将堆转储保存到本地, 请在应用程序窗口中右键单击heap dump, 然后选择Save As.
7.3 浏览堆转储 (Browsing a Heap Dump)
Java VisualVM enables you to visually browse heap dumps in the following views:
Java VisualVM使您可以在以下视图中以可视方式浏览堆转储:
7.3.2 摘要视图(Summary View)
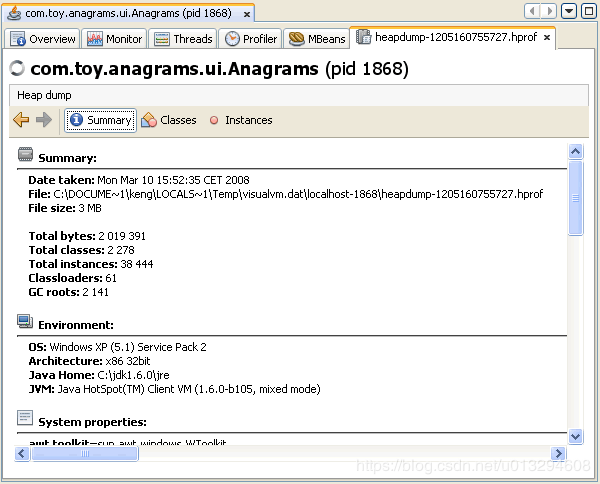
When you open a heap dump, Java VisualVM displays the Summary view by default. The Summary view displays the running environment where the heap dump was taken and other system properties.
打开堆转储时, Java VisualVM默认显示摘要视图. 摘要视图显示运行环境以及其他系统属性.
7.3.3 类视图(Classes View)
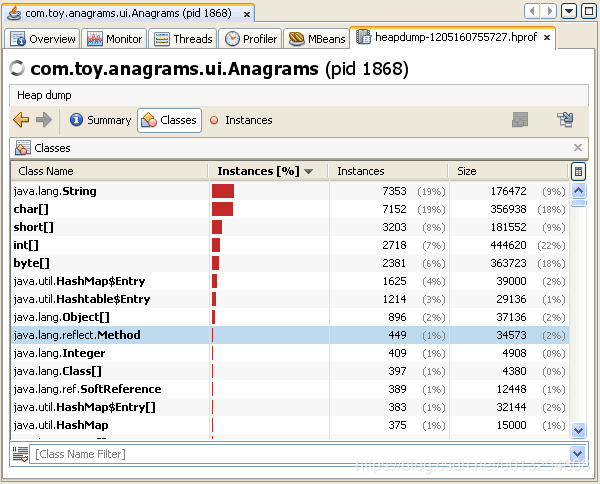
The Classes view displays a list of classes and the number and percentage of instances referenced by that class. You can view a list of the instances of a specific class by right-clicking the name and choosing Show in Instances View.
You can sort how results are displayed by clicking a column heading. You can use the filter below the list to filter the classes by name or limit the displayed results to sub-classes of a class by right-clicking a class name and choosing Show Only Subclasses.
类视图显示类的列表以及该类引用的实例的数量和百分比. 您可以通过右击类名称并选择Show in Instances View来查看特定类的实例列表.
您可以通过点击列名对结果的显示方式进行排序. 您可以使用列表下方的过滤器按名称过滤类, 或通过右键类名并选择“Show Only Subclasses”将显示的结果限制为类的子类.
7.3.4 实例视图(Instances View)
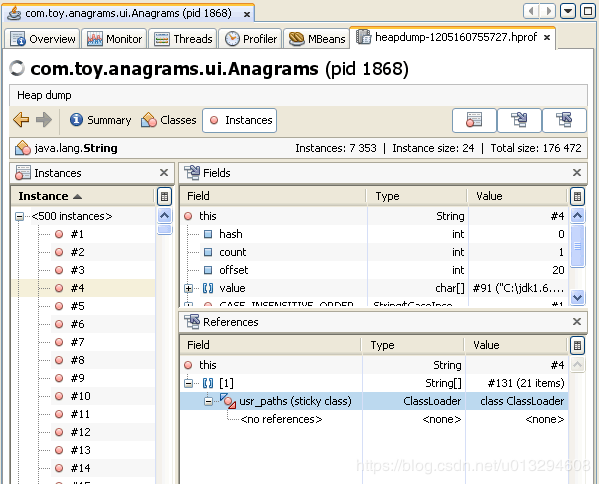
The Instance view displays object instances for a selected class. When you select an instance from the Instance pane, Java VisualVM displays the fields of that class and references to that class in the respective panes. In the References pane, you can right-click an item and choose Show Nearest GC Root to display the nearest garbage collection root object.
实例视图显示所选类的对象实例. 从实例窗格中选择实例时, Java VisualVM将在相应窗格中显示该类的字段以及对该类的引用. 在引用窗格中, 可以右键某个项目, 然后选择“Show Nearest GC Root”以显示最近的垃圾回收根对象。
8 查看应用程序概述(Viewing Application Overview)
Java VisualVM presents data for local and remote applications in a tab specific for that application. When you open an application in Java VisualVM, each application opens in a new tab in the main window. You can have multiple application tabs open.
The Overview tab is opened by default when viewing application data for local applications and remote applications.
Java VisualVM 在一个特定于该应用程序的选项卡中展示本地和远程应用程序的数据. 在Java VisualVM中打开应用程序时, 每个应用程序都会在主窗口的新选项卡中打开. 您可以打开多个应用程序选项卡.
查看 本地应用 和 远程应用 的数据时会默认打开概述选项卡.
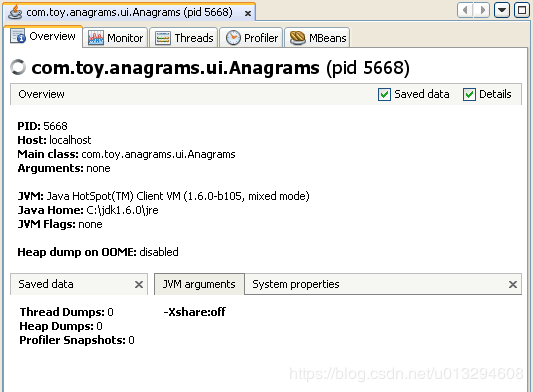
8.1 概述(Overview)
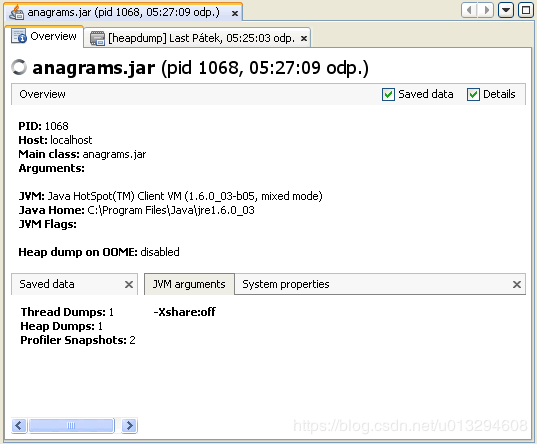
The Overview tab displays the following general information about the application and the runtime environment.
- PID. This is the process ID of the application. The process ID is also displayed next to the application node in the Applications window.
- Host. This is the location of the system that the application is running on.
- Main class. The class containing the
mainmethod. - Arguments. Displays any options passed to the application on startup.
- JVM. This is the JDK version of the JVM software.
- Java Home. This is the location of the JDK software.
- JVM flags. This displays any flags used by the JVM software when starting the JDK software.
- Heap dump on OOME. This displays the status of the Heap Dump on OOME option. When enabled, a heap dump is taken when the application encounters an OutOfMemory exception. You can enabled or disable the option in the application popup menu.
概述选项卡包含以下有关应用程序和运行时环境的常规信息.
- PID. 应用程序的进程ID. 进程ID也会显示在应用程序窗口中应用程序节点旁.
- Host. 运行应用程序的系统的位置.
- Main class. 包含
main方法的类. - Arguments. 显示在启动应用程序时,传递给应用程序的所有选项.
- JVM. JVM所属JDK的版本.
- Java Home. JDK的位置.
- JVM flags. 显示启动JDK时JVM使用的所有标志(flags).
- Heap dump on OOME. 显示OOME选项上堆转储的状态. 启用后, 当应用发生OutOfMemory异常时会记录堆转储. 您可以在应用程序弹出菜单中启用或禁用该选项.
8.2 保存数据(Saved Data)
This sub-tab displays application information that Java VisualVM has stored about the application.
此子选项卡显示Java VisualVM存储的关于此应用程序的信息.
8.3 JVM软件参数(JVM Software Arguments)
This sub-tab displays information about arguments passed to the JVM software on application startup.
此子选项卡显示在启动应用程序时,传递给JVM的参数信息.
8.4 系统属性(System Properties)
This sub-tab displays information about the system that the JVM software is running on.
此子选项卡显示运行JVM系统的信息.
9 监控应用程序(Monitoring an Application)
Java VisualVM presents data for local and remote applications in a tab specific for that application. When you open an application in Java VisualVM, each application opens in a new tab in the main window. You can have multiple application tabs open.
Java VisualVM 在该应用特定的选项卡中展示本地和远程应用的数据. 在Java VisualVM中打开应用时, 每个应用都会在主窗口的新选项卡中打开. 您可以打开多个应用程序选项卡.
9.1 监控应用程序
You can use Java VisualVM to monitor a local application and view real-time, high-level data on the memory heap, thread activity, and the classes loaded in the Java Virtual Machine (JVM). Monitoring an application imposes low overhead and can be used for extended periods.
您可以使用Java VisualVM监控本地应用, 查看内存堆上的实时高级(high-level)数据, 线程活动和JVM加载的类. 监控产生的开销很低并可长期使用.
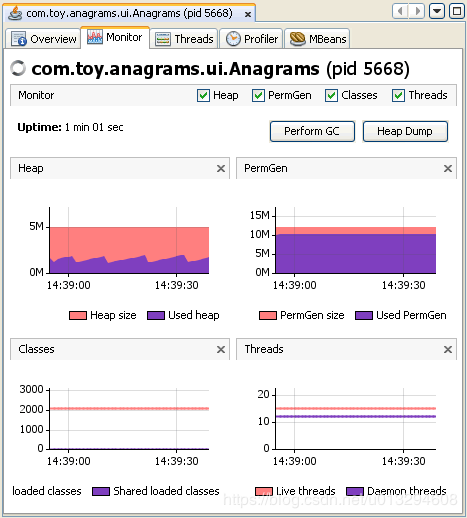
Monitoring data is displayed in the following graphs:
- Heap. The Heap graph displays the total heap size and how much of the heap is currently used. These are the figures that a Java technology-based application (Java application) can obtain using the
java.lang.Runtime.totalMemory()and java.lang.Runtime.freeMemory() calls. - PermGen. The PermGen graph displays changes in the permanent generation area over time. The permanent generation is the area of the heap where class and method objects are stored. If an application loads a very large number of classes, then the size of the permanent generation might need to be increased using the
-XX:MaxPermSizeoption. - **Classes. ** The Classes graph displays an overview of the total number of loaded classes and shared classes.
- Threads. The Threads graphs displays an overview of the number of live and daemon threads in the application’s JVM. You can use Java VisualVM to take a thread dump if you want to capture and view exact data on application threads at a specific point in time. For more about working with threads, see the following document:
- Monitoring Application Threads
监控数据如下图所示:
- Heap. 堆图表显示总堆大小和当前堆使用量, 基于Java实现的应用程序可以通过调用"java.lang.Runtime.totalMemory()" 和 "java.lang.Runtime.freeMemory()"获得.
- PermGen. PermGen图表显示永生代区域随时间的变化. 永生代是类和方法对象存储在堆上的区域. 如果应用加载了大量的类, 则可能需要修改
-XX:MaxPermSize参数用来增加永生代的大小. - Classes. Classes图表显示已加载类和共享类的总数.
- Threads. Threads图表显示应用JVM中活动线程和守护线程的数量. 如果要查看并保存某时刻应用线程上的确切数据, 可以使用Java VisualVM进行线程转储. 有关使用线程的更多信息, 请参阅以下文档:
- 应用线程监控
The Monitoring tab contains buttons that enable you to perform the following actions:
- Perform GC. Click Perform GC to perform garbage collection immediately.
- Heap Dump. Click Heap Dump to take a heap dump. When you take a heap dump, a tab displaying the heap dump opens in the application tab. A node for the heap dump appears under the node for the application in the Applications window. For more about working with a heap dump, see the following document:
- Browsing a Heap Dump
监控选项卡包含以下功能按钮:
- Perform GC. 单击"Perform GC" 以立即执行垃圾回收.
- Heap Dump. 单击"Heap Dump"以执行堆转储. 执行堆转储时, 将在应用选项卡中打开堆转储的选项卡. 堆转储的节点位于应用窗口中应用的节点下方. 有关使用堆转储的更多信息, 请参阅以下文档:
- 浏览堆转储
10 监控应用程序线程(Monitoring Application Threads)
Java VisualVM presents data for local and remote applications in a tab specific for that application. Application tabs are displayed in the main window to the right of the Applications window. You can have multiple application tabs open at one time. Each application tab contains sub-tabs that display different types of information about the application.
Java VisualVM在特定于该应用程序的选项卡中显示本地和远程应用程序的数据。应用程序选项卡显示在“应用程序”窗口右侧的主窗口中。您可以一次打开多个应用程序选项卡。每个应用程序选项卡都包含显示有关应用程序的不同类型信息的子选项卡。
10.1 监控线程活动(Monitoring Thread Activity)
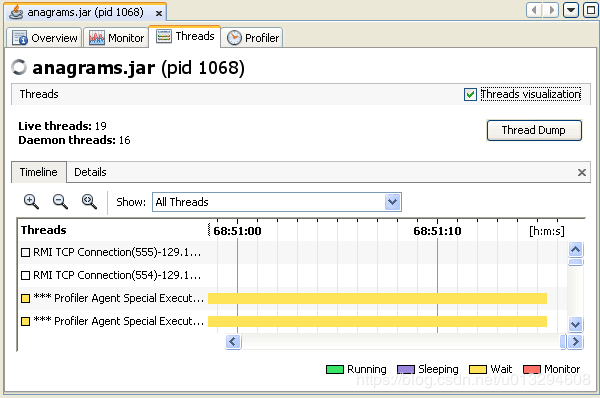
Java VisualVM displays real-time, high-level data on thread activity in the Threads tab.
Note: The information displayed in the Threads tab is based on Java Management Extensions (JMX). The Threads tab is visible if Java VisualVM can make a JMX technology-based connection (JMX connection) with the target application and retrieve JMX instrumentation from the Java Virtual Machine (JVM). If the target application is a local application running on Java Development Kit (JDK) version 1.6, the JMX connection is made automatically. If the target application is not running on JDK version 1.6, you may need to explicitly establish a JMX connection with the JVM software. For more on establishing a JMX connection, see the following document:
- Connecting to JMX Agents Explicitly
By default the Threads tab displays a timeline of current thread activity. You can click a thread in the timeline to view details about that thread in the Details tab.
Java VisualVM在“线程”选项卡中显示有关线程活动的实时高级数据。
注意:“线程”选项卡中显示的信息基于Java Management Extensions(JMX)。如果Java VisualVM可以与目标应用程序建立基于JMX技术的连接(JMX连接)并从Java虚拟机(JVM)检索JMX检测,则“线程”选项卡可见。如果目标应用程序是在Java Development Kit(JDK)1.6版上运行的本地应用程序,则会自动进行JMX连接。如果目标应用程序未在JDK 1.6版上运行,则可能需要使用JVM软件显式建立JMX连接。有关建立JMX连接的更多信息,请参阅以下文档:
- [显示地连接到JMX代理](#11 显式地连接到JMX代理(Connecting to JMX Agents Explicitly))
默认情况下,“线程”选项卡显示当前线程活动的时间轴。您可以单击时间轴中的某个线程,以在“详细信息”选项卡中查看有关该线程的详细信息。
10.1.1 时间轴选项卡(Timeline Tab)
This tab displays a timeline with real-time thread states. Use the buttons in the Timeline toolbar to zoom in/out on the current view and to switch to the Scale to Fit mode. The drop-down list enables you to select which threads are displayed. You can choose to view all threads, live threads or finished threads. You can also select a single thread or multiple threads to display a subset of the threads. You can double-click on a thread timeline to open that thread in the Details tab.
此选项卡显示具有实时线程状态的时间轴。使用“时间轴”工具栏中的按钮放大/缩小当前视图并切换到“缩放至适合”模式。使用下拉列表可以选择显示哪些线程。您可以选择查看所有线程,活动线程或完成的线程。您还可以选择单个线程或多个线程来显示线程的子集。您可以双击线程时间轴以在“详细信息”选项卡中打开该线程。
A timeline for each thread provides a quick overview of the thread’s activity.
10.1.2 明细选项卡(Details Tab)
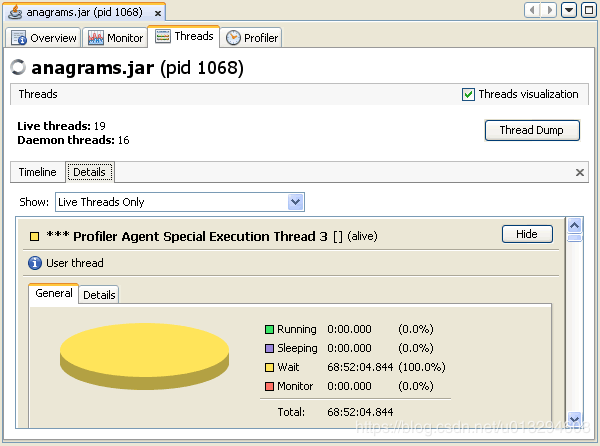
The Details tab displays more detailed information about individual threads. Using the drop-down list, you can select to display all threads, all live threads or all finished threads. You can also choose to display only the details of threads selected in the Timeline view. For each thread, the name, classname and current status (alive/finished) are displayed. A short description of the thread is also provided.
Each thread displayed in the Details tab has the following tabs:
- General. This tab displays thread states statistics.
- Details. This tab contains full listings of thread states with timestamps.
A timeline for each thread provides a quick overview of the thread’s activity.
明细选项卡显示有关各个线程的更多详细信息。使用下拉列表,您可以选择显示所有线程,所有活动线程或所有已完成的线程。您还可以选择仅显示在时间轴视图中选择的线程的详细信息。对于每个线程,将显示名称,类名和当前状态(alive / finished)。还提供了该线程的简短描述。
详细信息选项卡中显示的每个线程都有以下选项卡:
- 一般. 此选项卡显示线程状态统计信息
- 细节. 此选项卡包含带有时间戳的线程状态的完整列表。
每个线程的时间轴提供了线程活动的快速概述。
[外链图片转存失败(img-lwBGX3Wc-1565528539244)(C:\Work\Develop\study\VisualVM\thread-details-screen.png)]
10.3 获取线程Dump(Taking a Thread Dump)
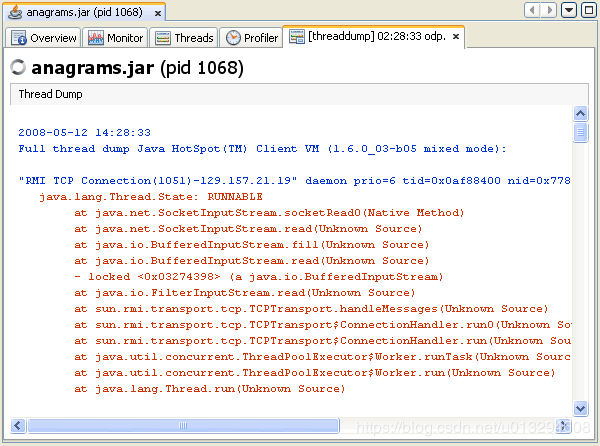
You can use Java VisualVM to take a thread dump (stack trace) while a local application is running. Taking a thread dump does not stop the application. When you print the thread dump you get a printout of the thread stack that includes thread states for the Java threads.
When you print a thread dump in Java VisualVM, the tool prints a stack trace of the active threads of the application. Using Java VisualVM to take a thread dump can be very convenient in cases where you do not have a command-line console for the application. You can use a stack trace to help diagnose a number of issues such as deadlocks or when an application hangs.
Screenshot of thread dump (stack trace) in thread dump sub-tab.
在本地应用程序运行时,您可以使用Java VisualVM进行线程转储(堆栈跟踪)。进行线程转储不会停止应用程序。当您打印线程转储时,您将获得包含Java线程的线程状态的线程堆栈的打印输出。
在Java VisualVM中打印线程转储时,该工具会打印应用程序活动线程的堆栈跟踪。在没有应用程序的命令行控制台的情况下,使用Java VisualVM进行线程转储非常方便。您可以使用堆栈跟踪来帮助诊断许多问题,例如死锁或应用程序挂起时。
11 显式地连接到JMX代理(Connecting to JMX Agents Explicitly)
Java Management Extensions (JMX) technology can be used to monitor and manage any Java technology-based applications (Java applications) that are running in either a local or a remote Java Virtual Machine (JVM). Java applications are automatically exposed for monitoring and management by JMX agents if they are run on the Java platform, Standard Edition (Java SE platform) version 6. If the Java applications are running on the Java 2 platform, Standard Edition (J2SE platform) 5.0, you can expose them manually for monitoring and management by setting the com.sun.management.jmxremote.* system properties when the applications are launched. Setting these system properties, or running your applications on version 6 of the Java SE platform, enables the platform’s out-of-the-box monitoring and management capability, automatically enabling the platform MBean server in the JVM software, and registering MBeans in it that expose the application for management by any appropriately configured JMX client application. VisualVM is one such JMX client application.
Java Management Extensions(JMX)技术可用于监视和管理在本地或远程Java虚拟机(JVM)中运行的任何基于Java技术的应用程序(Java应用程序)。如果Java应用程序在Java平台Standard Edition(Java SE平台)版本6上运行,则Java应用程序会自动公开以供JMX代理进行监视和管理。如果Java应用程序在Java 2平台上运行,则标准版(J2SE平台)5.0 ,您可以通过在启动应用程序时设置com.sun.management.jmxremote。系统属性来手动公开它们以进行监视和管理。设置这些系统属性,或在Java SE平台的第6版上运行应用程序,使平台能够开箱即用 监视和管理功能,自动启用JVM软件中的平台MBean服务器,并在其中注册MBean,通过任何适当配置的JMX客户端应用程序公开应用程序以进行管理。VisualVM就是这样一个JMX客户端应用程序。
NOTE: For a very brief introduction to JMX technology, MBeans, the platform MBean server, and how to monitor and manage MBeans using Java VisualVM, see the Java VisualVM MBeans Tab page. For an introduction to the Java SE platform’s out-of-the-box monitoring and management capability, see Monitoring and Management Using JMX Technology in the Java SE Platform Monitoring and Management Guide.
注意:有关JMX技术,MBean,平台MBean服务器以及如何使用Java VisualVM监视和管理MBean的简要介绍,请参阅Java VisualVM MBeans选项卡页面。有关Java SE平台开箱即用的监视和管理功能的介绍,请参阅“ Java SE平台监视和管理指南”中的使用JMX技术进行 监视和管理。
11.1 何时需要显式JMX连接(When Are Explicit JMX Connections Necessary?)
As stated above, Java VisualVM will automatically detect and connect to Java applications that are running on version 6 of the Java SE platform or that have been started with the correct system properties on version 5.0. However, because there are cases in which Java VisualVM cannot automatically discover and connect to JMX agents that are running in a target Java application, a means of creating explicit JMX connections has also been added to Java VisualVM.
如上所述,Java VisualVM将自动检测并连接到Java SE平台版本6上运行的Java应用程序,或者已在5.0版本上使用正确的系统属性启动的Java应用程序。但是,由于Java VisualVM无法自动发现并连接到目标Java应用程序中运行的JMX代理,因此Java VisualVM中还添加了创建显式JMX连接的方法。
The circumstances in which Java VisualVM will not automatically discover JMX agents, and thus the Java applications they expose, are the following:
- The target application is running on the J2SE 5.0 platform and the -Dcom.sun.management.jmxremote* properties have not been specified.
- The target application is running on the same host as Java VisualVM but was started by a different user than the one who started Java VisualVM. Java VisualVM discovers running applications using the
jpstool (Solaris, Linux, or Mac OS X or Windows), which can only discover Java applications started by the same user as the one who starts the Java VisualVM tool. - The target application is running on a remote host where
jstatd(Solaris, Linux, or Mac OS X or Windows) is not running or is running but was started by a different user. Thejstatddaemon provides an interface that allows remote monitoring applications to connect to Java applications on the host where it is running.
Java VisualVM不会自动发现JMX代理以及它们公开的Java应用程序的情况如下:
- 目标应用程序在J2SE 5.0平台上运行,并且尚未指定*
-Dcom.sun.management.jmxremote*属性。 - 目标应用程序与Java VisualVM在同一主机上运行,但由启动Java VisualVM的用户启动。Java VisualVM使用
jps工具(Solaris,Linux或Mac OS X或Windows)发现正在运行的应用程序,该工具只能发现由启动Java VisualVM工具的用户启动的Java应用程序。 - 目标应用程序在远程主机上运行,其中
jstatd(Solaris,Linux或Mac OS X或Windows)未运行或正在运行但由其他用户启动。该jstatd守护进程提供了一个接口,它允许远程监控应用程序连接到Java应用程序,对于运行在主机上。
11.2 建立显式JMX连接(Making an Explicit JMX Connection)
Before you can make an explicit JMX connection from Java VisualVM to a running application, this application must be started with the correct system properties. The system properties in question are the following:
com.sun.management.jmxremote.port, to specify the port number through which the application will be exposedcom.sun.management.jmxremote.ssl, to specify whether secure sockets layer (SSL) encryption will be activated to secure the connection to the applicationcom.sun.management.jmxremote.authenticate, to specify whether the connection will be password protected
在从Java VisualVM到正在运行的应用程序进行显式JMX连接之前,必须使用正确的系统属性启动此应用程序。有问题的系统属性如下
com.sun.management.jmxremote.port,指定应用程序将通过其显示的端口号com.sun.management.jmxremote.ssl,指定是否将激活安全套接字层(SSL)加密以保护与应用程序的连接com.sun.management.jmxremote.authenticate,指定连接是否受密码保护
11.2.1 本地JMX连接(Local JMX Connections)
This section shows an example of how to connect Java VisualVM to a local application via an explicit JMX connection.
本节显示如何通过显式JMX连接将Java VisualVM连接到本地应用程序的示例。
-
Start a Java application on the J2SE platform version 5.0, setting the system properties to enable the Java SE platform’s out-of-the-box monitoring and management capability, using the command shown below:
在J2SE平台版本5.0上启动Java应用程序,使用以下命令设置系统属性以启用Java SE平台的开箱即用监视和管理功能:
java -Dcom.sun.management.jmxremote.port=3333 \
     -Dcom.sun.management.jmxremote.ssl=false \
     -Dcom.sun.management.jmxremote.authenticate=false \
     YourJavaApp
In the command above,YourJavaApp is launched with the Java SE platform’s out-of-the-box monitoring and management capability configured as follows:
- The application is exposed for monitoring and management via port 3333.
- SSL encryption is deactivated.
- Password authentication is deactivated.
在上面的命令中,使用Java SE平台的开箱即用监视和管理功能启动YourJavaApp
- 该应用程序通过端口3333进行监视和管理。
- SSL加密已停用。
- 密码验证已停用
-
Start Java VisualVM on the same machine.
在同一台计算机上启动Java VisualVM。
-
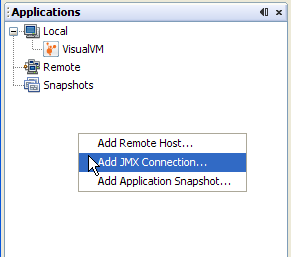
In Java VisualVM’s Applications window, right click on the Local machine and select ‘Add JMX Connection’.
在Java VisualVM的Applications窗口中,右键单击Local机器并选择’Add JMX Connection’。

-
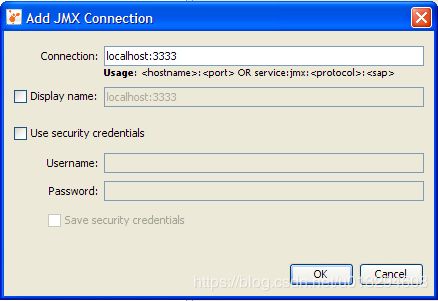
The Add JMX Connection dialog box opens.
The host name localhost is already filled in. You only need to add the port number on which the application is exposed for monitoring and management.
已填写主机名localhost。您只需添加应用程序所在的端口号以进行监视和管理。
-
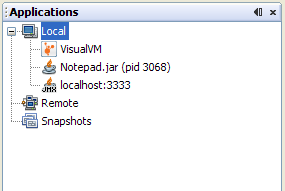
Click OK. The JMX connection will appear in the application tree, with a special JMX connection icon.
-
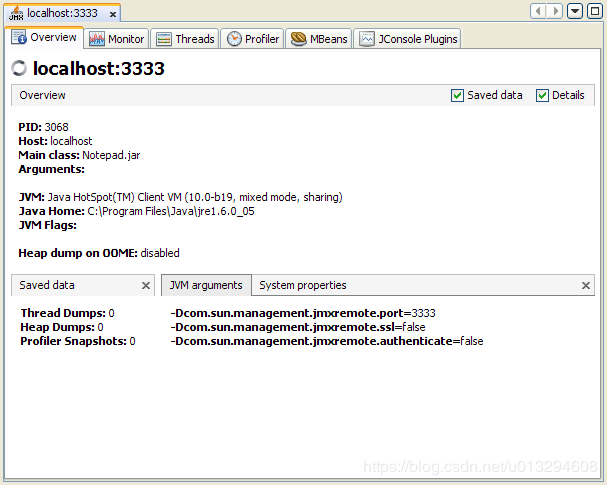
Right click on the JMX connection, and select Open. The JVM software exposed via the JMX connection can now be monitored and managed via Java VisualVM.
11.2.2 远程JMX连接(Remote JMX Connections)
You can also make explicit JMX connections to applications running on remote hosts, as explained below:
您还可以与远程主机上运行的应用程序建立明确的JMX连接,如下所述:
-
Right click anywhere in the blank area under the application tree and select Add JMX Connection.
-
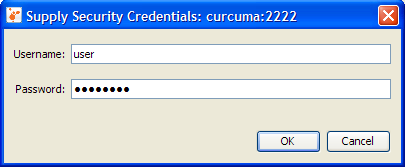
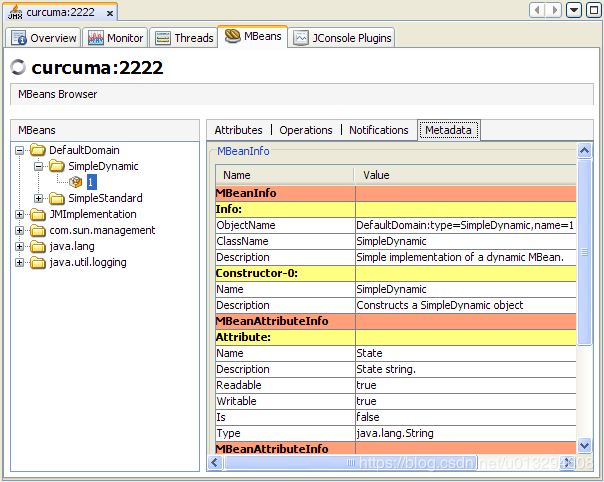
Provide the machine name and port number for a running JMX agent, that has been started with the appropriate system properties to allow remote management. Here the JMX agent has been exposed on port 2222 of the machine curcuma.
提供正在运行的JMX代理的计算机名称和端口号,该代理已使用适当的系统属性启动以允许远程管理。这里JMX代理已暴露在机器curcuma的端口2222上
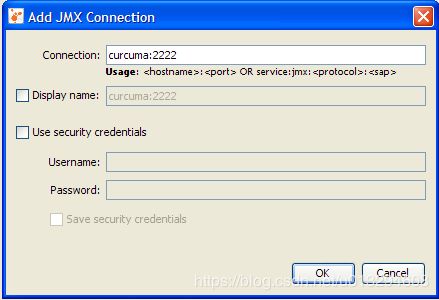
If you know that the JMX agent has been protected with a username and password, enter them in the Add JMX Connection dialog and specify whether you want the credentials to be saved so
that when Java VisualVM restarts it will silently reconnect to the JMX agent without prompting the user for the security credentials again.如果您知道JMX代理已使用用户名和密码进行保护,请在“添加JMX连接”对话框中输入它们,并指定是否要保存凭据,以便在Java VisualVM重新启动时它将无提示地重新连接到JMX代理而不会提示用户再次获得安全凭证
-
If the JMX connection is secured and you did not provide a username and password in the Add JMX Connection dialog, you will be prompted to provide a username and password.
-
If you know the correct username and password, the JMX connection will be established, and the JMX connection will appear in the application tree, with a special JMX connection icon.
-
Right click on the remote JMX connection and select Open. You can now monitor and manage remote applications via the JMX connection, and manipulate any MBeans that are registered in the MBean server exposed by this connection (note that the Java VisualVM-MBeans plugin must be installed if you want to access to the MBeans tab.)
右键单击远程JMX连接,然后选择“打开”。您现在可以通过JMX连接监视和管理远程应用程序,并操纵在此连接公开的MBean服务器中注册的任何MBean(请注意,如果要访问MBeans选项卡,则必须安装Java VisualVM-MBeans插件
11.3 关于JMX技术的进一步阅读(Further Reading About JMX Technology)
For more information about JMX technology and monitoring and management of the Java SE platform, see the following documents.
- JMX technology trail in the Java Tutorials
- Java Management Extensions (JMX) product page
- Monitoring and Management documentation for the Java SE Platform
有关JMX技术以及Java SE平台的监视和管理的更多信息,请参阅以下文档
- Java教程中的JMX技术路径
- Java Management Extensions(JMX)产品页面
- Java SE平台的监视和管理文档
12 应用程序性能(Profiling Applications)
Java VisualVM presents data for local and remote applications in a tab specific for that application. You can have multiple application tabs open. Each application tab contains sub-tabs that display different types of information about the application.
VisualVM在一个特定于该应用程序的标签中显示本地和远程应用程序的数据。您可以打开多个应用程序标签。每个应用程序标签包含子标签,这些子标签显示关于应用程序的不同类型的信息。
12.1 Profiling applications
The Profiler tab of an application enables you to start and stop the profiling session of a local application. Profiling results are displayed in the Profiler tab. You can use the toolbar to refresh the profiling results, invoke garbage collection and save the profiling data.
By default the profiling tool is not running until you are ready to profile the application. You can choose from the following profiling options:
- CPU Profiling. Choose this to profile the performance of the application.
- Memory Profiling. Choose this to analyze the memory usage of the application. The results display the objects allocated by the application and the class allocating those objects.
When you start a profiling session, Java VisualVM attaches to the local application and starts collecting profiling data. When profiling results are available they are automatically displayed in the Profiler tab.
应用程序的Profiler标签允许启动和停止本地应用程序的分析会话。分析结果显示在Profiler标签中。您可以使用工具栏刷新分析结果,调用垃圾收集并保存分析数据。
默认情况下,在您准备对应用程序进行分析之前,profiling工具是不会运行的。您可以从以下profiling选项中选择:
- CPU Profiling. 选择此选项可分析应用程序的性能。
- Memory Profiling. 选择此选项来分析应用程序的内存使用情况,结果显示应用程序分配的对象和分配这些对象的类。
启动分析会话时,VisualVM附加到本地应用程序并开始收集分析数据。当分析结果可用时,它们会自动显示在Profiler标签中。
12.1.1 使用工具栏(Using the toolbar)
You can use the following buttons in the Profiling Results toolbar to work with profiling results:
- Update Result Automatically. When active, the displayed profiling results are automatically updated at short intervals (about 2 seconds).
- Update Result Now. Click to update results immediately.
- Run Garbage Collection. Click to run garbage collection.
- Reset Collected Results. Click to discard the already accumulated profiling results.
- Take Snapshot. Click to take a snapshot of the current profile data. When you take a snapshot, the snapshot is opened in a new sub-tab.
- Save Current View. Click to save the current view of the profiling results as a
.pngimage file. When you click the button you are prompted to choose the location where you want to save the image.
您可以使用“分析结果”工具栏中的以下按钮来处理分析结果:
- 自动更新结果. 当激活时,显示的分析结果将在短时间间隔(大约2秒)内自动更新。
- 现在更新结果. 点击此处可立即更新结果。
- 运行垃圾回收. 点击此处可运行垃圾回收
- 重置收集结果. 点击此处可丢弃已累积的分析结果。
- 快照. 单击以获取当前分析数据的快照。当您拍摄快照时,快照将在一个新的标签中打开。
- 保存当前视图. 单击此处可将分析结果的当前视图保存为
.png图片文件。当您单击该按钮时,将提示您选择要保存图片的位置。
12.1.2 过滤分析结果(Filtering profiling results)
The filter box below the profiling results enables you to filter the displayed results according to the name of the method. To filter the results, enter a term in the method name filter box, select which filtering method to use and press Return. You can see and select previous filter terms by clicking the arrow to the right of the method name filter box.
分析结果下面的筛选框使您能够根据方法的名称帅选显示的结果。要筛选结果,请在方法名称筛选框中输入一个术语,选择要使用的筛选方法并按返回。您可以通过单击方法名称筛选器框右侧的箭头来查看和选择以前的筛选器。
12.1.3 修改分析设置(Modifying profiling settings)
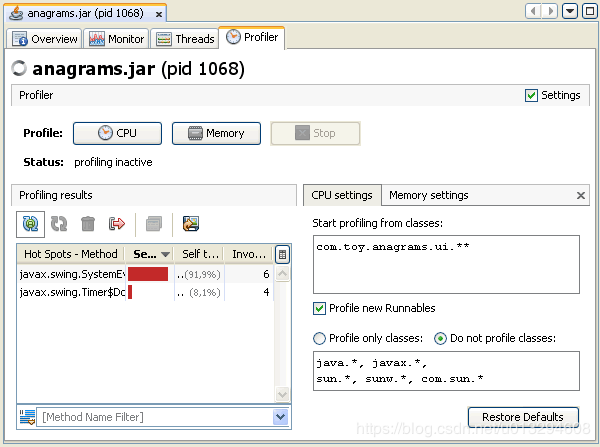
The Java VisualVM profiling tool supplies default settings for profiling applications. You can view the default settings by selecting the Settings checkbox in the Profiler tab. You can modify the profiling settings when no profiling session is in progress.
VisualVM分析工具为分析应用程序提供默认设置。您可以通过选择Profiler标签中的设置复选框来查看默认设置。当没有进行分析会话时,可以修改分析设置。
12.2 CPU Profiling
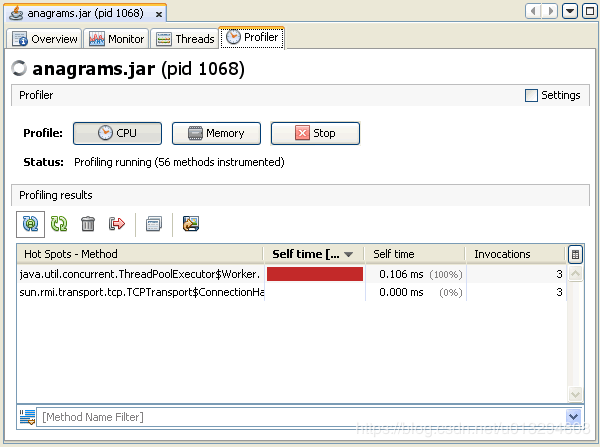
This profile command returns detailed data on method-level CPU performance (execution time), showing the total execution time and number of invocations for each method. When analyzing application performance, VisualVM instruments all of the methods of the profiled application. Threads emit the “method entry” event when entering a method and generate the corresponding “method exit” event when exiting the method. Both of these events contain timestamps. This data is processed in real time.
这个Profile命令返回方法级CPU性能(执行时间)的详细数据,显示每个方法的总执行时间和调用次数。在分析应用程序性能时,VisualVM测试了所分析应用程序的所有方法。线程在输入方法时发出“方法入口”事件,在退出方法时生成相应的“方法出口”事件。这两个事件都包含时间戳。这些数据是实时处理的。
Screenshot of Profiler tab showing CPU profiling results
Screenshot of Profiler tab showing CPU profiling settings
12.3 Memory Profiling
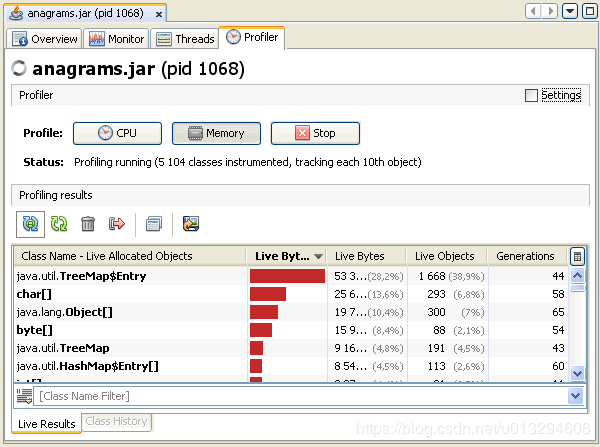
When you analyse memory usage, Java VisualVM starts instrumenting the loaded classes and displays the total number of objects allocated by each class (including array classes) in a table. For each class currently loaded class in the Java Virtual Machine (JVM), the profiling results display the size and number of objects allocated since the profiling session started. The results are automatically updated as new objects are allocated and as new classes are loaded.
Java VisualVM displays the number of objects as an absolute number and as a percentage. The bytes allocated are also displayed as a graph representing the percentage of bytes as well as the total number of bytes allocated by each class.
在分析内存使用情况时,VisualVM开始检测加载的类,并在表中显示每个类(包括数组类)分配的对象的总数。对于Java虚拟机(JVM)中当前加载的每个类,分析结果显示自分析会话启动以来分配的对象的大小和数量。当分配新对象和加载新类时,结果将自动更新。
VisualVM以绝对值和百分比的形式显示对象的数量。分配的字节也显示为一个图形,表示字节的百分比以及每个类分配的字节总数。
Screenshot of Profiler tab showing memory profiling results
Screenshot of Profiler tab showing memory profiling settings
12.4 Taking Profiler Snapshots
Java VisualVM enables you to take profiler snapshots to capture the results of a profiling session. A profiler snapshot captures the results at the moment the snapshot is taken. To take a snapshot, click the Take Snapshot of Collected Results button in the toolbar while a profiling session is in progress. When you take the snapshot, the snapshot opens as a tab in the application tab. A node for the snapshot also appears under the application node in the Applications window.
VisualVM允许您使用分析器快照来捕获分析会话的结果。分析器快照捕获快照拍摄时的结果。要获取快照,请在分析会话进行期间单击工具栏中的“收集快照结果”的按钮。当您获取快照时,快照将作为一个标签在该应用程序标签中打开。快照的节点也会出现在“应用程序”窗口的“应用程序”节点下。
Screenshot of memory profiling snapshot
内存分析快照的屏幕截图
Screenshot of CPU profiling snapshot
CPU分析快照的屏幕截图
For more about profiler snapshots, see the following document:
- Working with Snapshots
更多关于Profiler快照的相关信息,请参见如下文档。
- 使用快照
