Xv6 Lab1手记
环境: Ubuntu_LTS18.04 _64位
课程:https://pdos.csail.mit.edu/6.828/2018/schedule.html (2018年秋季)
我跟着官方文件来的,和网上一些其他的开源教程可能有所区别。
Lab 1: Booting a PC
Part 1: PC Bootstrap
$ git clone https://pdos.csail.mit.edu/6.828/2018/jos.git lab
Cloning into lab...
进入 lab文件夹
$ cd lab
$ make
+ as kern/entry.S
+ cc kern/entrypgdir.c
+ cc kern/init.c
+ cc kern/console.c
+ cc kern/monitor.c
+ cc kern/printf.c
+ cc kern/kdebug.c
+ cc lib/printfmt.c
+ cc lib/readline.c
+ cc lib/string.c
+ ld obj/kern/kernel
+ as boot/boot.S
+ cc -Os boot/main.c
+ ld boot/boot
boot block is 380 bytes (max 510)
+ mk obj/kern/kernel.img
编译lab时报错:
lib/printfmt.c:42:对‘__udivdi3’未定义的引用
lib/printfmt.c:50:对‘__umoddi3’未定义的引用
原因:由于在printfmt.c文件中用了libgcc.a中的库函数,但是我使用的是64位的ubuntu,没有这个库文件。
解决:
sudo apt-get install gcc-multilib
//参考http://www.cnblogs.com/ccode/p/4513378.html
然后使用qemu加载xv6系统
$ make qemu
sed "s/localhost:1234/localhost:26000/" < .gdbinit.tmpl > .gdbinit
qemu-system-i386 -drive file=obj/kern/kernel.img,index=0,media=disk,format=raw -serial mon:stdio -gdb tcp::26000 -D qemu.log
Could not initialize SDL(No available video device) - exiting
GNUmakefile:156: recipe for target 'qemu' failed
make: *** [qemu] Error 1
报错原因在SDL,搜索后得知
SDL的功能很好用,也比较强大,不过它也有一个局限性,就是在创建客户机并以SDL方式显示时,它会直接弹出一个窗口,所以SDL方式只能在图形界面中使用。如果在非图形界面中(如ssh连接到宿主机中),使用SDL时会出现如下的错误信息。
[root@jay-linux kvm_demo]# qemu-system-x86_64 rhel6u3.img
Could not initialize SDL(No available video device) - exiting
来源:http://smilejay.com/2012/08/kvm-sdl-display/
我恰是在服务器上搭了ubuntu,然后ssh连接到服务器,这样看来还得使用图形界面。
使用win10远程连接ubuntu18.04参考这里
来源:https://blog.csdn.net/clksjx/article/details/83445127
但其实官方教程提供了不需要图形的命令。
Alternatively, you can use the serial console without the virtual VGA by running make qemu-nox. This may be convenient if you are SSH'd into an Athena dialup. To quit qemu, type Ctrl+a x.
我们使用make qemu-nox,成功进入
$make qemu-nox

Booting from Hard Disk...
6828 decimal is XXX octal!
entering test_backtrace 5
entering test_backtrace 4
entering test_backtrace 3
entering test_backtrace 2
entering test_backtrace 1
entering test_backtrace 0
leaving test_backtrace 0
leaving test_backtrace 1
leaving test_backtrace 2
leaving test_backtrace 3
leaving test_backtrace 4
leaving test_backtrace 5
Welcome to the JOS kernel monitor!
Type 'help' for a list of commands.
K>
根据官方教程,我们输入两条指令help和kerninfo
K> help
help - display this list of commands
kerninfo - display information about the kernel
K> kerninfo
Special kernel symbols:
  entry  f010000c (virt)  0010000c (phys)
  etext  f0101a75 (virt)  00101a75 (phys)
  edata  f0112300 (virt)  00112300 (phys)
  end    f0112960 (virt)  00112960 (phys)
Kernel executable memory footprint: 75KB
K>
成功显示内容。
ctrl+a,x,可以退出这个kernel。
早期PC的内存地址空间
|
简单翻译一下。
表中为16bit的8088处理器的1MB地址空间结构。
显然早期PC的内存小的可怜,上表中只有Low Memory区域这640KB的空间,可以作为random-access memory (RAM)被早期PC使用。事实上更早的PC可能只有16KB,32KB,64KB的RAM。
在Low Memory往上,即 0x000A0000 ~ 0x000FFFFF 这 384KB的空间,是硬件的保留地址。
这些硬件保留地址里面,最重要的就是BIOS ROM,大小64KB,0x000F0000 ~ 0x000FFFFF 。【ROM,read-only memory】
早期PC的BIOS存在只读存储器ROM上,然而现在的PC把BIOS放在可更新的flash memory(闪存)上。
BIOS的作用是initialize操作系统。
在支持4GB地址空间的Intel 80386问世后,为了保证向后兼容能力【in order to ensure backward compatibility】,我们还是沿用旧制,保留了最低的1MB地址空间。
所以现代PC的内存空间是有【hole】的,即0x000A0000 到 0x00100000,此【洞】长达384KB 。 这个洞下面是最早的640KB的RAM区域,用来运行上古时代的程序。这个洞中间的地址已经被放弃了,现代的硬件需要的地址空间可不是区区384KB可以放得下了。现代的BIOS的地址区域会在32-bit内存的高一点的某个位置。
当然,随着时代发展后面的processor支持了远超4GB的内存空间,于是BIOS这些又要移动位置,这一移动又要留下一个【洞】。
此处我们为了简化,假设世上所有的PC都只有32-bit的的地址空间。(即最大4GB)
The ROM BIOS
打开一个新的终端窗口,进入lab。
$ make gdb
GNU gdb (GDB) 6.8-debian
Copyright (C) 2008 Free Software Foundation, Inc.
License GPLv3+: GNU GPL version 3 or later
This is free software: you are free to change and redistribute it.
There is NO WARRANTY, to the extent permitted by law.  Type "show copying"
and "show warranty" for details.
This GDB was configured as "i486-linux-gnu".
+ target remote localhost:26000
The target architecture is assumed to be i8086
[f000:fff0] 0xffff0:	ljmp   $0xf000,$0xe05b
0x0000fff0 in ?? ()
+ symbol-file obj/kern/kernel
(gdb)
我们提供了 .gdbinit 文件,来设置GDB去调试早期启动时的16-bit代码,同时将它链接至QEMU。如果不起作用就自己手动修改一下,增加一项add-auto-load-safe-path。
The following line:
[f000:fff0] 0xffff0: ljmp $0xf000,$0xe05b
is GDB's disassembly of the first instruction to be executed. From this output you can conclude a few things:
- The IBM PC starts executing at physical address 0x000ffff0, which is at the very top of the 64KB area reserved for the ROM BIOS.
- The PC starts executing with CS = 0xf000 and IP = 0xfff0.
- The first instruction to be executed is a jmp instruction, which jumps to the segmented address CS = 0xf000 and IP = 0xe05b.
0xffff0 is 16 bytes before the end of the BIOS (0x100000). Therefore we shouldn't be surprised that the first thing that the BIOS does is jmp backwards to an earlier location in the BIOS; after all how much could it accomplish in just 16 bytes?
emm,可能因为我是64位,反正我的起始地址跟它不一样。是0xf010034e。按教材来好了。
使用si指令,Step Instruction,可以追踪。
初始化一堆事情之后,BIOS会找到一个bootable的disk,然后读取上面的boot loader,并把控制权交给它【transfers control to it】。
输入q,可以退出gdb。
Part 2: The Boot Loader
bootable的硬件会被分成512B的sectors。
第一个boot sector会被BIOS读取到物理地址0x7c00 ~ 0x7dff 这片内存上。然后使用一个jump指令,设置CS:IP 为 0000:7c00 。
别问为什么是这0x7c00这个地址,就是如此霸道,不管,反正已经是既成标准事实了。
关于怎么从CD-ROM启动系统可以看"El Torito" Bootable CD-ROM Format Specification"。此处略去。
boot loader 由一个assembly language(汇编语言) source file, boot/boot.S, 和一个C语言source file, boot/main.c ,共同组成。
Look through these source files carefully and make sure you understand what's going on. The boot loader must perform two main functions:
- First, the boot loader switches the processor from real mode to 32-bit protected mode, because it is only in this mode that software can access all the memory above 1MB in the processor's physical address space. Protected mode is described briefly in sections 1.2.7 and 1.2.8 of PC Assembly Language, and in great detail in the Intel architecture manuals. At this point you only have to understand that translation of segmented addresses (segment:offset pairs) into physical addresses happens differently in protected mode, and that after the transition offsets are 32 bits instead of 16.
- Second, the boot loader reads the kernel from the hard disk by directly accessing the IDE disk device registers via the x86's special I/O instructions. If you would like to understand better what the particular I/O instructions here mean, check out the "IDE hard drive controller" section on the 6.828 reference page. You will not need to learn much about programming specific devices in this class: writing device drivers is in practice a very important part of OS development, but from a conceptual or architectural viewpoint it is also one of the least interesting
总之就是要我们去看懂2个文件嘛。
先来看boot.S的源码解读,可以看一下这篇xv6启动源码阅读,不过这位兄弟上的是2017的课,所以代码跟我在2018的课上下载的有所区别。
#include

# Start the CPU: switch to 32-bit protected mode, jump into C.
# The BIOS loads this code from the first sector of the hard disk into
# memory at physical address 0x7c00 and starts executing in real mode
# with %cs=0 %ip=7c00.

.set PROT_MODE_CSEG, 0x8         # kernel code segment selector
.set PROT_MODE_DSEG, 0x10        # kernel data segment selector
.set CR0_PE_ON,      0x1         # protected mode enable flag

.globl start
start:
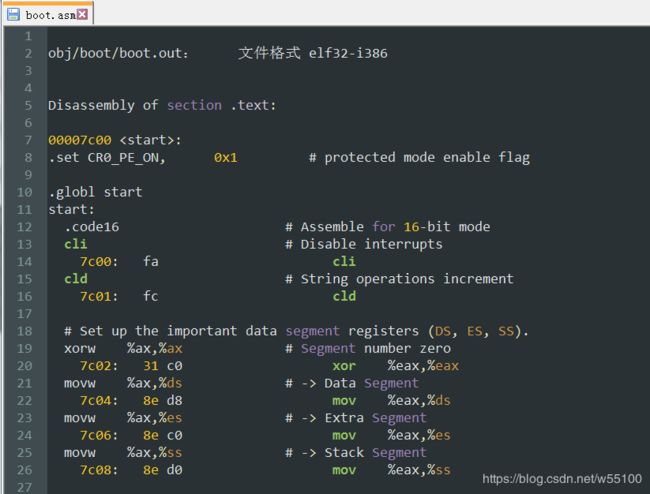
  .code16                     # Assemble for 16-bit mode,表示这段代码是16-bit的
  cli                         # Disable interrupts
  cld                         # String operations increment

  #下面的操作把AX,DS,ES,SS都初始化成0
  # Set up the important data segment registers (DS, ES, SS).
  xorw    %ax,%ax             # Segment number zero
  movw    %ax,%ds             # -> Data Segment
  movw    %ax,%es             # -> Extra Segment
  movw    %ax,%ss             # -> Stack Segment

  # Enable A20:
  #   For backwards compatibility with the earliest PCs, physical
  #   address line 20 is tied low, so that addresses higher than
  #   1MB wrap around to zero by default.  This code undoes this.
seta20.1:
  inb     $0x64,%al               # Wait for not busy
  testb   $0x2,%al
  jnz     seta20.1

  movb    $0xd1,%al               # 0xd1 -> port 0x64
  outb    %al,$0x64

seta20.2:
  inb     $0x64,%al               # Wait for not busy
  testb   $0x2,%al
  jnz     seta20.2

  movb    $0xdf,%al               # 0xdf -> port 0x60
  outb    %al,$0x60

#上述代码其他都看不懂,但是根据解说,0xdf这句,
#给controller发送命令0xDF,置A20 gate 有效,于是第21位的数据不会被清0
#结束后,准备离开实模式

  # Switch from real to protected mode, using a bootstrap GDT
  # and segment translation that makes virtual addresses
  # identical to their physical addresses, so that the
  # effective memory map does not change during the switch.
  lgdt    gdtdesc    #可以看下面的gdt和gdtdesc两部分
  movl    %cr0, %eax
  orl     $CR0_PE_ON, %eax
  movl    %eax, %cr0

  # Jump to next instruction, but in 32-bit code segment.
  # Switches processor into 32-bit mode.
  ljmp    $PROT_MODE_CSEG, $protcseg

  .code32                     # Assemble for 32-bit mode
protcseg:
  # Set up the protected-mode data segment registers
  movw    $PROT_MODE_DSEG, %ax    # Our data segment selector #数据段存入ax
  movw    %ax, %ds                # -> DS: Data Segment    #然后ds,es,ss都指向数据段
  movw    %ax, %es                # -> ES: Extra Segment
  movw    %ax, %fs                # -> FS
  movw    %ax, %gs                # -> GS
  movw    %ax, %ss                # -> SS: Stack Segment

  # Set up the stack pointer and call into C.
  movl    $start, %esp
  call bootmain

  # If bootmain returns (it shouldn't), loop.
spin:
  jmp spin

# Bootstrap GDT
.p2align 2                                # force 4 byte alignment
gdt:
  SEG_NULL				# null seg
  SEG(STA_X|STA_R, 0x0, 0xffffffff)	# code seg
  SEG(STA_W, 0x0, 0xffffffff)	        # data seg

gdtdesc:
  .word   0x17                            # sizeof(gdt) - 1
  .long   gdt                             # address gdt
第二个是 main.C 文件
#include
#include

/**********************************************************************
 * This a dirt simple boot loader, whose sole job is to boot
 * an ELF kernel image from the first IDE hard disk.
 *
 * DISK LAYOUT
 *  * This program(boot.S and main.c) is the bootloader.  It should
 *    be stored in the first sector of the disk.
 *
 *  * The 2nd sector onward holds the kernel image.
 *
 *  * The kernel image must be in ELF format.
 *
 * BOOT UP STEPS
 *  * when the CPU boots it loads the BIOS into memory and executes it
 *
 *  * the BIOS intializes devices, sets of the interrupt routines, and
 *    reads the first sector of the boot device(e.g., hard-drive)
 *    into memory and jumps to it.
 *
 *  * Assuming this boot loader is stored in the first sector of the
 *    hard-drive, this code takes over...
 *
 *  * control starts in boot.S -- which sets up protected mode,
 *    and a stack so C code then run, then calls bootmain()
 *
 *  * bootmain() in this file takes over, reads in the kernel and jumps to it.
 **********************************************************************/

#define SECTSIZE	512
#define ELFHDR		((struct Elf *) 0x10000) // scratch space

void readsect(void*, uint32_t);
void readseg(uint32_t, uint32_t, uint32_t);

void
bootmain(void)
{
	struct Proghdr *ph, *eph;

	// read 1st page off disk
	readseg((uint32_t) ELFHDR, SECTSIZE*8, 0);

	// is this a valid ELF?
	if (ELFHDR->e_magic != ELF_MAGIC)
		goto bad;

	// load each program segment (ignores ph flags)
	ph = (struct Proghdr *) ((uint8_t *) ELFHDR + ELFHDR->e_phoff);
	eph = ph + ELFHDR->e_phnum;
	for (; ph < eph; ph++)
		// p_pa is the load address of this segment (as well
		// as the physical address)
		readseg(ph->p_pa, ph->p_memsz, ph->p_offset);

	// call the entry point from the ELF header
	// note: does not return!
	((void (*)(void)) (ELFHDR->e_entry))();

bad:
	outw(0x8A00, 0x8A00);
	outw(0x8A00, 0x8E00);
	while (1)
		/* do nothing */;
}

// Read 'count' bytes at 'offset' from kernel into physical address 'pa'.
// Might copy more than asked
void
readseg(uint32_t pa, uint32_t count, uint32_t offset)
{
	uint32_t end_pa;

	end_pa = pa + count;

	// round down to sector boundary
	pa &= ~(SECTSIZE - 1);

	// translate from bytes to sectors, and kernel starts at sector 1
	offset = (offset / SECTSIZE) + 1;

	// If this is too slow, we could read lots of sectors at a time.
	// We'd write more to memory than asked, but it doesn't matter --
	// we load in increasing order.
	while (pa < end_pa) {
		// Since we haven't enabled paging yet and we're using
		// an identity segment mapping (see boot.S), we can
		// use physical addresses directly.  This won't be the
		// case once JOS enables the MMU.
		readsect((uint8_t*) pa, offset);
		pa += SECTSIZE;
		offset++;
	}
}

void
waitdisk(void)
{
	// wait for disk reaady
	while ((inb(0x1F7) & 0xC0) != 0x40)
		/* do nothing */;
}

void
readsect(void *dst, uint32_t offset)
{
	// wait for disk to be ready
	waitdisk();

	outb(0x1F2, 1);		// count = 1
	outb(0x1F3, offset);
	outb(0x1F4, offset >> 8);
	outb(0x1F5, offset >> 16);
	outb(0x1F6, (offset >> 24) | 0xE0);
	outb(0x1F7, 0x20);	// cmd 0x20 - read sectors

	// wait for disk to be ready
	waitdisk();

	// read a sector
	insl(0x1F0, dst, SECTSIZE/4);
}
After you understand the boot loader source code, look at the file obj/boot/boot.asm. This file is a disassembly of the boot loader that our GNUmakefile creates after compiling the boot loader. This disassembly file makes it easy to see exactly where in physical memory all of the boot loader's code resides, and makes it easier to track what's happening while stepping through the boot loader in GDB. Likewise, obj/kern/kernel.asm contains a disassembly of the JOS kernel, which can often be useful for debugging.
You can set address breakpoints in GDB with the b command. For example, b *0x7c00 sets a breakpoint at address 0x7C00. Once at a breakpoint, you can continue execution using the c and si commands: c causes QEMU to continue execution until the next breakpoint (or until you press Ctrl-C in GDB), and si N steps through the instructions N at a time.
To examine instructions in memory (besides the immediate next one to be executed, which GDB prints automatically), you use the x/i command. This command has the syntax x/Ni ADDR, where N is the number of consecutive instructions to disassemble and ADDR is the memory address at which to start disassembling.
介绍了一些指令,嫌烦可以先不看。
Exercise 3. Take a look at the lab tools guide, especially the section on GDB commands. Even if you're familiar with GDB, this includes some esoteric GDB commands that are useful for OS work.
Set a breakpoint at address 0x7c00, which is where the boot sector will be loaded. Continue execution until that breakpoint. Trace through the code in boot/boot.S, using the source code and the disassembly file obj/boot/boot.asm to keep track of where you are. Also use the x/i command in GDB to disassemble sequences of instructions in the boot loader, and compare the original boot loader source code with both the disassembly in obj/boot/boot.asm and GDB.
Trace into bootmain() in boot/main.c, and then into readsect(). Identify the exact assembly instructions that correspond to each of the statements in readsect(). Trace through the rest of readsect() and back out into bootmain(), and identify the begin and end of the for loop that reads the remaining sectors of the kernel from the disk. Find out what code will run when the loop is finished, set a breakpoint there, and continue to that breakpoint. Then step through the remainder of the boot loader.
他建议我们看一下https://pdos.csail.mit.edu/6.828/2018/labguide.html 里的 GDB部分。
但是,我好像做不了Excerceise3。
我仔细对比了一下,别人的程序入口都好好的从0xf000:fff0开始,而且会显示i8086。
(别人的图)
(下面是我的图)
我的入口是一个很奇怪的地址。第一行指令跟他们也不一样。
而且target architecture is assumed to be i386。
可别人的都是i8086啊!!!
......
花了好久终于搞定了。
前面说过我们ssh登陆的用户,要用make qemu-nox对吧。
对应于gdb调试。应该有2个窗口。
一个窗口输入make qemu-nox-gdb。
另一个窗口输入make gdb。
现在正常了!
继续Excercise3。
然后在0x7c00处打个断点。
再去对照 boot/boot.S 和 obj/boot/boot.asm ,确定整个过程中我们所在的位置。
使用i r,显示所有寄存器中的值。可以看到当前我们在cs:ip = f000:fff0的位置。
此时其他寄存器SS,DS,ES,FS,GS,都是0。
使用 x/5i $eip, 表示从$eip地址开始,显示接下来的5条汇编指令。
不过这里我们还在i8086实模式下,需要$cs*16+$eip 才能获取到真实地址。
此处的$eip并非真实指令地址,所以看起来显得很蠢。
按c会直接运行到断点处,或者ctrl+c人为传送中断信号。
由于前面在0x7c00处打过断点,所以会在这里停下来。
此处i r一下,会发现eax,edx,esp,eflags都改了。eip显然变成了0x7c00不用说。几个寄存器还是0。
注意,由于我们还在实模式,所以此处地址是0:7c00。
不过段是0,所以可以用$eip=0x7c00代替真实地址0x07c00。
于是我们使用x /5i $eip查看接下来的5条机器指令。
很眼熟吧,这就是我们写的start:部分。可以在boot.S里面找到,也可以看更人性化的boot.asm文件。
输入一次si回车,然后一直敲回车可以持续跟踪。
这个地方很奇怪的点在于,别的命令都是遵循汇编后的指令,比如7c1c处的,7c1e处的。
到了7c21处,这行指令就不显示了,不知道为什么。
观察右侧窗口,7c1e的下一条指令为7c23处的mov %cr0,%eax。
在左侧窗口,7c23这条指令是属于【原始代码】的,而非汇编产物。
再到下一条7c26处的代码,左右又恢复了正常的一一对应关系。
而中间的7c21与7c24两条指令,在右侧窗口中就消失了,不见了。
看不懂。
继续回车运行,结束实模式,来到32-bit的保护模式下。
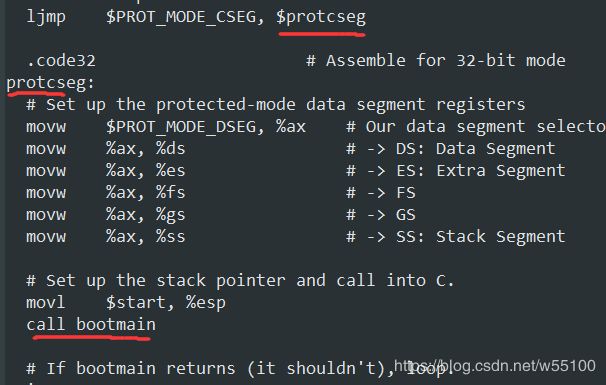
对应源文件,就是运行了这句ljmp,从实模式切换到protect模式,来到了protcseg。
在protcseg里,我们一行行运行,最后到达call bootmain
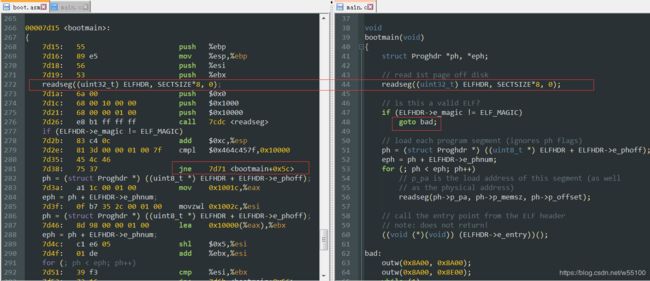
运行了call bootmain,我们进入main.C文件,地址是0x7d15。
bootmain函数是这样的
追踪完bootmain之后,继续看指导手册。
官方问了我们4个问题
- At what point does the processor start executing 32-bit code? What exactly causes the switch from 16- to 32-bit mode?
- What is the last instruction of the boot loader executed, and what is the first instruction of the kernel it just loaded?
- Where is the first instruction of the kernel?
- How does the boot loader decide how many sectors it must read in order to fetch the entire kernel from disk? Where does it find this information?
第一个很显然。运行了ljmp $PROT_MOD_CSEG,$protcseg 这句之后就切换战斗形态了。
第二个,可以截图看到main.C的最后一句代码是
整个bootmain函数的作用就是,从硬盘里读取kernel的镜像文件,然后跳到entry入口,开始执行kernel。
这个镜像文件是按照elf格式存在硬盘上的。
ELFHDR是指向0x10000,整个kern程序块是从0x10000(物理地址)开始运行的。
而entry入口是啥呢?我们之前就有做过实验的。
输入kerninfo之后,明明白白告诉了你entry是在0xf010000c的虚拟地址上,转化为物理地址是0x10000c。
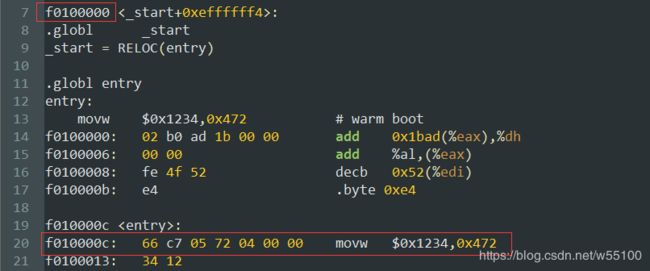
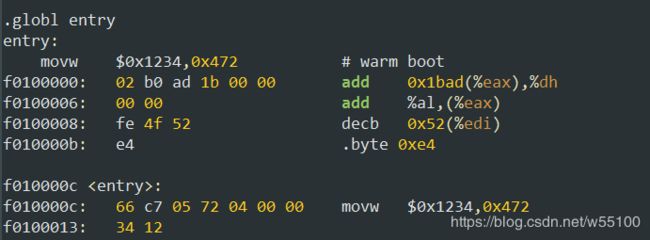
看obj/kern/kern.asm文件,也能印证。
我们从从0xf0100000(虚拟地址)开始,跳到entry入口0xf010000c。
第二问的后半部分是这个kern的一条指令是什么,答案是0xf010000c处的 mov $0x1234,0x472 。
第三问,kernel的第一条指令在哪,我们也回答过了,虚拟0xf010000c,物理0x10000c。
第四问,bootloader怎么知道kernel在硬盘上占据多少个sector呢?
答,elf里面有写的。
下面是网上找来的图,意思就是说elf这种格式的文件呢,明明白白的告诉了你有哪些sections,每个section的LMA(load memory address,去哪里读)是什么,从这个LMA开始应该读多少size,都写的清清楚楚了。
为了更好理解第四问,
我们再看main.C里面定义的readsec函数。
是不是对outb 0x1F2~0x1F7感到绝望? 不知道是做什么的?
不要怕,我们有万能的互联网。
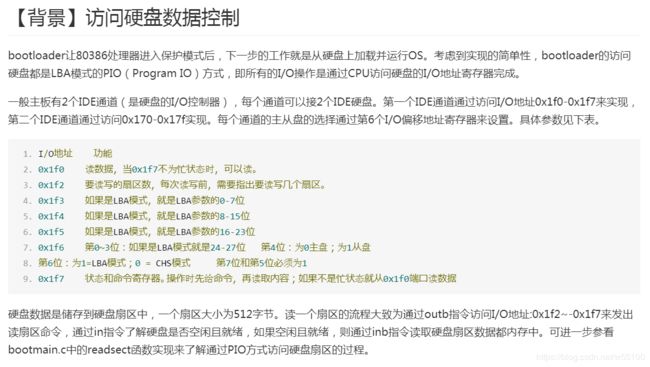
可以看一下ucore的参考手册 https://www.bookstack.cn/read/simple_os_book/zh-chapter-1-access_harddisk.md
不理解具体内容也没关系,只需要看这句话。
一个扇区大小为512字节。读一个扇区的流程大致为通过outb指令访问I/O地址:0x1f2~-0x1f7来发出读扇区命令,通过in指令了解硬盘是否空闲且就绪,如果空闲且就绪,则通过inb指令读取硬盘扇区数据都内存中。
这就是我们的readsect函数里面,为什么0x1F2~0x1F7一顿猛操作之后,又wait了一下等待空闲就绪,然后insl指令读取到内存。
虽然这个手册里面讲的是inb读取,而我们的 readsect函数是insl读取。我也不懂为什么,有人知道的话请指教。
Loading the Kernel
来到实验4
Exercise 4. Read about programming with pointers in C. The best reference for the C language is The C Programming Language by Brian Kernighan and Dennis Ritchie (known as 'K&R'). We recommend that students purchase this book (here is an Amazon Link) or find one of MIT's 7 copies.
Read 5.1 (Pointers and Addresses) through 5.5 (Character Pointers and Functions) in K&R. Then download the code for pointers.c, run it, and make sure you understand where all of the printed values come from. In particular, make sure you understand where the pointer addresses in printed lines 1 and 6 come from, how all the values in printed lines 2 through 4 get there, and why the values printed in line 5 are seemingly corrupted.
There are other references on pointers in C (e.g., A tutorial by Ted Jensen that cites K&R heavily), though not as strongly recommended.
Warning: Unless you are already thoroughly versed in C, do not skip or even skim this reading exercise. If you do not really understand pointers in C, you will suffer untold pain and misery in subsequent labs, and then eventually come to understand them the hard way. Trust us; you don't want to find out what "the hard way" is.
这个pointers.c文件的代码我贴一下。
#include
#include

void f(void)
{
    int a[4];
    int *b = malloc(16);
    int *c;
    int i;

    printf("1: a = %p, b = %p, c = %p\n", a, b, c);

    c = a;
    for (i = 0; i < 4; i++)
	a[i] = 100 + i;
    c[0] = 200;
    printf("2: a[0] = %d, a[1] = %d, a[2] = %d, a[3] = %d\n",
	   a[0], a[1], a[2], a[3]);

    c[1] = 300;
    *(c + 2) = 301;
    3[c] = 302;
    printf("3: a[0] = %d, a[1] = %d, a[2] = %d, a[3] = %d\n",
	   a[0], a[1], a[2], a[3]);

    c = c + 1;
    *c = 400;
    printf("4: a[0] = %d, a[1] = %d, a[2] = %d, a[3] = %d\n",
	   a[0], a[1], a[2], a[3]);

    c = (int *) ((char *) c + 1);
    *c = 500;
    printf("5: a[0] = %d, a[1] = %d, a[2] = %d, a[3] = %d\n",
	   a[0], a[1], a[2], a[3]);

    b = (int *) a + 1;
    c = (int *) ((char *) a + 1);
    printf("6: a = %p, b = %p, c = %p\n", a, b, c);
}

int main(int ac, char **av)
{
    f();
    return 0;
}
这部分是希望你熟悉一下c的指针。如果很熟了就下一步。
To make sense out of boot/main.c you'll need to know what an ELF binary is. When you compile and link a C program such as the JOS kernel, the compiler transforms each C source ('.c') file into an object ('.o') file containing assembly language instructions encoded in the binary format expected by the hardware. The linker then combines all of the compiled object files into a single binary image such as obj/kern/kernel, which in this case is a binary in the ELF format, which stands for "Executable and Linkable Format".
想看懂man.c文件,你就要懂ELF二进制格式。编译之时每一个.c文件会被编译器transform成一个object文件(以.o后缀),object文件里面是二进制编码成的汇编语言指令。链接器再把所有object文件组合成成一个二进制的image文件,就如 obj/kern/kernel一样。本例中,kernel不但是二进制的image文件,还是一个ELF格式的二进制文件。
Full information about this format is available in the ELF specification on our reference page, but you will not need to delve very deeply into the details of this format in this class. Although as a whole the format is quite powerful and complex, most of the complex parts are for supporting dynamic loading of shared libraries, which we will not do in this class. The Wikipedia page has a short description.
For purposes of 6.828, you can consider an ELF executable to be a header with loading information, followed by several program sections, each of which is a contiguous chunk of code or data intended to be loaded into memory at a specified address. The boot loader does not modify the code or data; it loads it into memory and starts executing it.
An ELF binary starts with a fixed-length ELF header, followed by a variable-length program header listing each of the program sections to be loaded. The C definitions for these ELF headers are in inc/elf.h. The program sections we're interested in are:
- .text: The program's executable instructions.
- .rodata: Read-only data, such as ASCII string constants produced by the C compiler. (We will not bother setting up the hardware to prohibit writing, however.)
- .data: The data section holds the program's initialized data, such as global variables declared with initializers like int x = 5;.
When the linker computes the memory layout of a program, it reserves space for uninitialized global variables, such as int x;, in a section called .bss that immediately follows .data in memory. C requires that "uninitialized" global variables start with a value of zero. Thus there is no need to store contents for .bss in the ELF binary; instead, the linker records just the address and size of the .bss section. The loader or the program itself must arrange to zero the .bss section.
这里它简单介绍了一下ELF格式,其实上面我就放过图了。
我们使用它提供的命令
objdump -h obj/kern/kernel可以查看 the full list of the names, sizes, and link addresses of all the sections in the kernel executable
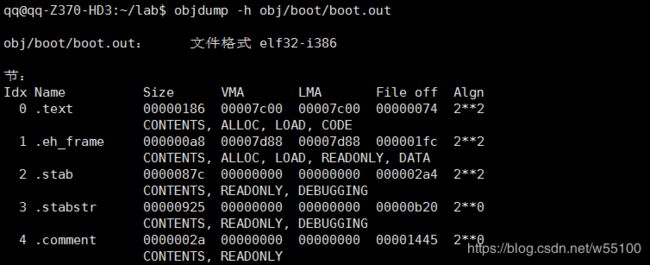
Typically, the link and load addresses are the same. For example, look at the .text section of the boot loader:
使用命令
objdump -x obj/kern/kernel可以看到.text里面,boot的链接和装载地址确实都是0x7c00。
The boot loader uses the ELF program headers to decide how to load the sections. The program headers specify which parts of the ELF object to load into memory and the destination address each should occupy.
You can inspect the program headers by typing:
objdump -x obj/kern/kernel这个返回结果很长。
obj/kern/kernel:     文件格式 elf32-i386
obj/kern/kernel
体系结构:i386, 标志 0x00000112:
EXEC_P, HAS_SYMS, D_PAGED
起始地址 0x0010000c

程序头:
    LOAD off    0x00001000 vaddr 0xf0100000 paddr 0x00100000 align 2**12
         filesz 0x0000759d memsz 0x0000759d flags r-x
    LOAD off    0x00009000 vaddr 0xf0108000 paddr 0x00108000 align 2**12
         filesz 0x0000b6a8 memsz 0x0000b6a8 flags rw-
   STACK off    0x00000000 vaddr 0x00000000 paddr 0x00000000 align 2**4
         filesz 0x00000000 memsz 0x00000000 flags rwx

节:
Idx Name          Size      VMA       LMA       File off  Algn
  0 .text         000019e9  f0100000  00100000  00001000  2**4
                  CONTENTS, ALLOC, LOAD, READONLY, CODE
  1 .rodata       000006c0  f0101a00  00101a00  00002a00  2**5
                  CONTENTS, ALLOC, LOAD, READONLY, DATA
  2 .stab         00003b95  f01020c0  001020c0  000030c0  2**2
                  CONTENTS, ALLOC, LOAD, READONLY, DATA
  3 .stabstr      00001948  f0105c55  00105c55  00006c55  2**0
                  CONTENTS, ALLOC, LOAD, READONLY, DATA
  4 .data         00009300  f0108000  00108000  00009000  2**12
                  CONTENTS, ALLOC, LOAD, DATA
  5 .got          00000008  f0111300  00111300  00012300  2**2
                  CONTENTS, ALLOC, LOAD, DATA
  6 .got.plt      0000000c  f0111308  00111308  00012308  2**2
                  CONTENTS, ALLOC, LOAD, DATA
  7 .data.rel.local 00001000  f0112000  00112000  00013000  2**12
                  CONTENTS, ALLOC, LOAD, DATA
  8 .data.rel.ro.local 00000044  f0113000  00113000  00014000  2**2
                  CONTENTS, ALLOC, LOAD, DATA
  9 .bss          00000648  f0113060  00113060  00014060  2**5
                  CONTENTS, ALLOC, LOAD, DATA
 10 .comment      0000002a  00000000  00000000  000146a8  2**0
                  CONTENTS, READONLY
SYMBOL TABLE:
f0100000 l    d  .text	00000000 .text
f0101a00 l    d  .rodata	00000000 .rodata
f01020c0 l    d  .stab	00000000 .stab
f0105c55 l    d  .stabstr	00000000 .stabstr
f0108000 l    d  .data	00000000 .data
f0111300 l    d  .got	00000000 .got
f0111308 l    d  .got.plt	00000000 .got.plt
f0112000 l    d  .data.rel.local	00000000 .data.rel.local
f0113000 l    d  .data.rel.ro.local	00000000 .data.rel.ro.local
f0113060 l    d  .bss	00000000 .bss
...
... #东西太多了,我省略一部分
...
f010088d g     F .text	00000163 monitor
f01016aa g     F .text	0000001d memfind
f0100762 g     F .text	00000050 mon_help
The program headers are then listed under "Program Headers" in the output of objdump. The areas of the ELF object that need to be loaded into memory are those that are marked as "LOAD". Other information for each program header is given, such as the virtual address ("vaddr"), the physical address ("paddr"), and the size of the loaded area ("memsz" and "filesz").
我们来看返回结果的最上端,“程序头”这一块,需要被loaded的elf对象都在前面用LOAD标识了。而且贴心的给出了虚拟地址和物理地址,vaddr,paddr,还提供了filesz和memsz。
再回来看 boot/main.c文件。每一个程序头的 ph->p_pa 域都包含了这个segment的目标物理地址。注意,这个p_pa是说,把数据从硬盘上读出来之后,要存在内存的哪个位置。
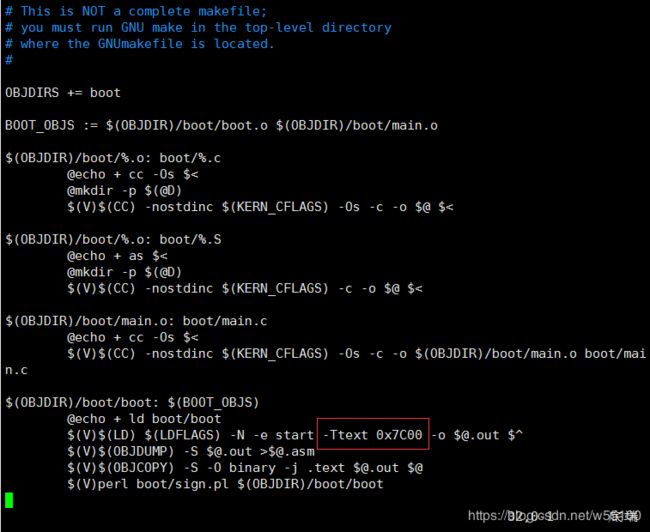
The BIOS loads the boot sector into memory starting at address 0x7c00, so this is the boot sector's load address. This is also where the boot sector executes from, so this is also its link address. We set the link address by passing -Ttext 0x7C00 to the linker in boot/Makefrag, so the linker will produce the correct memory addresses in the generated code.
本例中0x7c00恰巧是boot sector需要读到内存中的位置。也恰好是最终需要执行的地址,即link address。所以我们在boot/Makefrag里设置为0x7c00,这样最终编译的结果就能正常运行。
那么问题就来了!倘若我不这么干呢!
倘若我搞点小破坏呢?
实验5
Exercise 5. Trace through the first few instructions of the boot loader again and identify the first instruction that would "break" or otherwise do the wrong thing if you were to get the boot loader's link address wrong. Then change the link address in boot/Makefrag to something wrong, run make clean, recompile the lab with make, and trace into the boot loader again to see what happens. Don't forget to change the link address back and make clean again afterward!
实验5就是让我们在 boot/Makefrag文件里面做点破坏,修改link address变成别的值,然后重新编译看看能否运行。
跟我来
vim boot/Makefrag #注意大写可以看到,我们把-Ttext 0x7C00 这句送给linker,才能让编译正常。
现在开始搞破坏,稍微修改一下,改成 -Ttext 0x7C01。
wq退出保存。
然后make编译一下。
看到obk/boot/boot.asm里的start已经从0x7c01开始了。
此时重复之前的make qemu-nox-gdb ,和 make gdb。
然后b *0x7c01,再c运行。会发现程序一直卡在循环里,不会中断,即始终到达不了0x7c01。
如果b *0x7c00,再c,那么程序会运行并中断在0x7c00处,此时si一步步跟踪会发现,一直在执行错误的代码。
You should now be able to understand the minimal ELF loader in boot/main.c. It reads each section of the kernel from disk into memory at the section's load address and then jumps to the kernel's entry point.
说实话,这部分我也没太明白到底怎么回事。。。。。。
make clean,把修改的东西改回来。 再make一下,还原。
实验6
Exercise 6. We can examine memory using GDB's x command. The GDB manual has full details, but for now, it is enough to know that the command x/Nx ADDR prints N words of memory at ADDR. (Note that both 'x's in the command are lowercase.) Warning: The size of a word is not a universal standard. In GNU assembly, a word is two bytes (the 'w' in xorw, which stands for word, means 2 bytes).
Reset the machine (exit QEMU/GDB and start them again). Examine the 8 words of memory at 0x00100000 at the point the BIOS enters the boot loader, and then again at the point the boot loader enters the kernel. Why are they different? What is there at the second breakpoint? (You do not really need to use QEMU to answer this question. Just think.)
让我们q退出GDB,再make gdb重新进一次。
看图,现在bootloader的入口,0x7c00打断点。
再去kernel的entry入口,0x10000c打断点。
运行到0x7c00时,查看0x10000c处的8个word,发现全是0。【1个word似乎是4字节】
运行到0x10000c时,再查看0x10000c处的8个word,发现有了数据。
这说明什么呢,刚开始运行bootloader的时候,kernel还没有被装入内存。
再次检查指令,可以确认0x100000处的指令和kernel.asm中的对得上。
Part 3: The Kernel
上面的实验里,我们看到了bootloader的load address和link address十分吻合。
然而kernel的link address和load address就存在悬殊的差异了。
举个例子,上文刻意回避了一个现象,kernel的entry在(虚拟地址,本例中似乎意同link address)0xf010000c,而(物理地址,本例中似乎意同load address)在0x10000c 。
操作系统的kernel呢,喜欢用一些较高的虚拟地址。这样可以保证低地址空间留给用户去使用。在lab2中我们可以更清晰的认识到为什么要这样做。此处记住这个事情就可以了。
但是用了很高很高的虚拟地址(例如0xf010000c)之后,物理内存上未必有这么高的地址呀。
于是我们高高拿起,低低放下,需要把虚拟地址0xf010000c,映射到物理地址0x10000c上。
Many machines don't have any physical memory at address 0xf0100000, so we can't count on being able to store the kernel there. Instead, we will use the processor's memory management hardware to map virtual address 0xf0100000 (the link address at which the kernel code expects to run) to physical address 0x00100000 (where the boot loader loaded the kernel into physical memory).
这是说,处理器自己内部就有一个内存管理硬件,可以自动实现【地址映射】。
This way, although the kernel's virtual address is high enough to leave plenty of address space for user processes, it will be loaded in physical memory at the 1MB point in the PC's RAM, just above the BIOS ROM. This approach requires that the PC have at least a few megabytes of physical memory (so that physical address 0x00100000 works), but this is likely to be true of any PC built after about 1990.
无论虚拟地址有多高呢,总会被映射到1MB的RAM位置,即0x100000 【你算一下正好是1MB】。这个位置恰好高于大小为1MB的BIOS ROM 。新世纪之后,我们现在的电脑显然都有>1MB的物理内存了。所以这个工作总是成立的。
In fact, in the next lab, we will map the entire bottom 256MB of the PC's physical address space, from physical addresses 0x00000000 through 0x0fffffff, to virtual addresses 0xf0000000 through 0xffffffff respectively. You should now see why JOS can only use the first 256MB of physical memory.
下节lab课,我将继续讲解地址映射,将底部256MB的物理内存完整映射到虚拟地址的顶部,实现虚拟物理两开花,请大家多多支持。(0x0fffffff -> 0xffffffff,别数了,7个f -> 8个f )
For now, we'll just map the first 4MB of physical memory, which will be enough to get us up and running. We do this using the hand-written, statically-initialized page directory and page table in kern/entrypgdir.c.
目前为止,我们只映射了物理地址的头4MB,0x400000 -> 0xf0400000 。 这足够我们来启动并运行了。
我们还使用了一个手动设置的、静态初始化的页表目录,存放在 kern/entrypgdir.c中。
这个entrypgdir.c也没什么东西,我就贴一下这个注释部分。
// The entry.S page directory maps the first 4MB of physical memory
// starting at virtual address KERNBASE (that is, it maps virtual
// addresses [KERNBASE, KERNBASE+4MB) to physical addresses [0, 4MB)).
// We choose 4MB because that's how much we can map with one page
// table and it's enough to get us through early boot.  We also map
// virtual addresses [0, 4MB) to physical addresses [0, 4MB); this
// region is critical for a few instructions in entry.S and then we
// never use it again.
//
// Page directories (and page tables), must start on a page boundary,
// hence the "__aligned__" attribute.  Also, because of restrictions
// related to linking and static initializers, we use "x + PTE_P"
// here, rather than the more standard "x | PTE_P".  Everywhere else
// you should use "|" to combine flags.
注释非常有意思的是提到了2点。
1) 虚拟地址空间的最高部分,[KernBase.KernBase+4MB) 映射到了 物理地址的 [0,4MB)。
2)虚拟地址空间的最低部分, [0,4MB) 映射到了 物理地址的 [0,4MB)。
也就是说,虚拟地址的0xf010000c 和 虚拟地址的 0x0010000c,指向的是同一个物理地址。
他说这种操作是因为entry.S里面有些指令要用,而且只用一次。
不是很懂。不过知道了有这么回事。
这个entrypgdir.c下面的手动写的页表可以看出来,一个页大小是4KB。
两个相邻页表的地址之差是3个16进制位,即12个2进制位,即2^12=4KB。
For now, you don't have to understand the details of how this works, just the effect that it accomplishes.
Up until kern/entry.S sets the CR0_PG flag, memory references are treated as physical addresses (strictly speaking, they're linear addresses, but boot/boot.S set up an identity mapping from linear addresses to physical addresses and we're never going to change that).
Once CR0_PG is set, memory references are virtual addresses that get translated by the virtual memory hardware to physical addresses.
entry_pgdir translates virtual addresses in the range 0xf0000000 through 0xf0400000 to physical addresses 0x00000000 through 0x00400000, as well as virtual addresses 0x00000000 through 0x00400000 to physical addresses
这是说,在entry.S里面设置了CR0_PG标志之后,程序内对内存的引用(memory references)就被作为物理地址来使用了。
原理是,CR0_PG设置好之后,memory references会被上文说的硬件翻译成物理地址,然后传给虚拟地址?
看不懂这段没关系,跟我看实验7。
Exercise 7. Use QEMU and GDB to trace into the JOS kernel and stop at the
movl %eax, %cr0. Examine memory at 0x00100000 and at 0xf0100000. Now, single step over that instruction using the stepi GDB command. Again, examine memory at 0x00100000 and at 0xf0100000. Make sure you understand what just happened.What is the first instruction after the new mapping is established that would fail to work properly if the mapping weren't in place? Comment out the
movl %eax, %cr0in kern/entry.S, trace into it, and see if you were right.
手动si到这条语句 movl %eax, %cr0,可以在entry.S里找到它。或者看kernel.asm也可以。
可以先在0x10000c处打个断点,方便快速接近目标地址。
详情见下图。
第一条si语句之后,显示下一条指令就是我们要找的 0x00100025 : mov %eax,%cr0。
此时查看内容,发现0xf0100000的内容全是0,而0x00100000是有内容的。
然后我们再次si,真正地运行了mov %eax,%cr0 这条指令。
再次查看内容,此时发现0xf0100000 的内容与 0x00100000的内容完全一致。
这是因为,一开始我们没有建立分页机制,0xf0开头的高地址对我们来说,跟0x00开头的低地址不是一回事。
“开启分页之后,由于有静态映射表的存在(kern/enterpgdir.c),两块虚拟地址都指向同一块物理地址区域。” 引自 JasonLeaster 同学。
Formatted Printing to the Console
Most people take functions like printf() for granted, sometimes even thinking of them as "primitives" of the C language. But in an OS kernel, we have to implement all I/O ourselves.
Read through kern/printf.c, lib/printfmt.c, and kern/console.c, and make sure you understand their relationship. It will become clear in later labs why printfmt.c is located in the separate lib directory.
我们需要阅读 kern/printf.c, lib/printfmt.c, and kern/console.c 这三个文件。
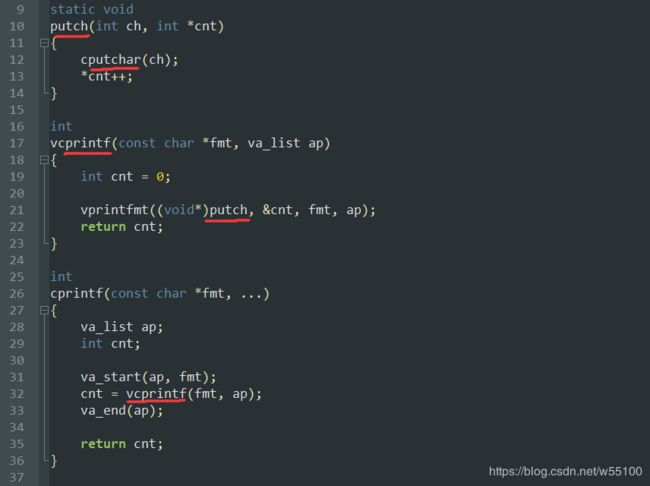
找到kern/printf.c文件,这东西对外暴露的接口是cprintf函数,里面调用vcprintf,再内层调用vprintfmt函数,传入一个putch函数。
其中putch函数的核心是cpuchar函数,定义在 kern/console.c中,效果是打印1个字符。
vcprintfmt函数 定义在 lib/printfmt.c 中,效果是根据【格式字符串】,选择一种格式来不断调用【打印函数】,本例中我们传入的打印函数是putch,所以最终会以特定的格式来调用cpuchar函数,实现格式化输出。
这部分蛮有意思的。在操作系统内核里面,所有的I/O操作都需要我们自己实现。
哪怕是简单的让操作系统在console界面print一点信息出来。
他还问我们,为什么 /lib/printfmt.c 这个文件是放在/lib/目录下的。
感觉只可意会不可言传啊。 vprintfmt函数是没有定义具体的【打印函数】的,也就是说,可以传入任意自定义的的【打印函数】。所以比kern/printf.c的抽象高了一层,不适合放在 kern/ 这个目录层级下。我们可以自己随便定义几个 user1/printf.c 然后传入新的 myputchar 给vprintfmt函数。 所以这东西可以看成【公共的】,于是就到了 lib/目录下了。
有了前置的知识,我们来看下一个实验。
实验8
Exercise 8. We have omitted a small fragment of code - the code necessary to print octal numbers using patterns of the form "%o". Find and fill in this code fragment.
让我们写一个根据"%o"【格式字符串】来输出【八进制数字】的函数。
他已经给了small fragment of code,像新鞋子里的填充泡沫棉一样,丢掉然后换成我们自己的代码即可,
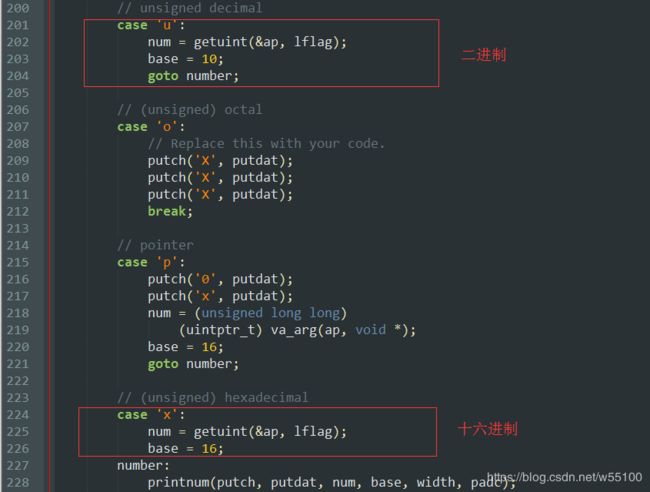
具体在 lib/printfmt.c的这个位置。 要打印成 (unsigned)octal。
该怎么做呢? 谜题:镜像。
我们看上下文,发现二进制decimal的代码就是3行,16进制hexadecimal的代码也是类似的。区别只有base不同。
很容易猜想,这个goto number 指向的函数,就是抽象出来的可以打印任意base的函数。
这样还不简单吗。把base换成8,答,显然。
我们也写3行,就完成了。
然后我们来看6个问题。
Be able to answer the following questions:
- Explain the interface between printf.c and console.c. Specifically, what function does console.c export? How is this function used by printf.c?
- Explain the following from console.c:
1 if (crt_pos >= CRT_SIZE) { 2 int i; 3 memmove(crt_buf, crt_buf + CRT_COLS, (CRT_SIZE - CRT_COLS) * sizeof(uint16_t)); 4 for (i = CRT_SIZE - CRT_COLS; i < CRT_SIZE; i++) 5 crt_buf[i] = 0x0700 | ' '; 6 crt_pos -= CRT_COLS; 7 }- For the following questions you might wish to consult the notes for Lecture 2. These notes cover GCC's calling convention on the x86.
Trace the execution of the following code step-by-step:
int x = 1, y = 3, z = 4;
cprintf("x %d, y %x, z %d\n", x, y, z);
- In the call to
cprintf(), to what doesfmtpoint? To what doesappoint?- List (in order of execution) each call to
cons_putc,va_arg, andvcprintf. Forcons_putc, list its argument as well. Forva_arg, list whatappoints to before and after the call. Forvcprintflist the values of its two arguments.- Run the following code.
What is the output? Explain how this output is arrived at in the step-by-step manner of the previous exercise. Here's an ASCII table that maps bytes to characters.unsigned int i = 0x00646c72; cprintf("H%x Wo%s", 57616, &i);The output depends on that fact that the x86 is little-endian. If the x86 were instead big-endian what would you set
ito in order to yield the same output? Would you need to change57616to a different value?Here's a description of little- and big-endian and a more whimsical description.
- In the following code, what is going to be printed after
'y='? (note: the answer is not a specific value.) Why does this happen?cprintf("x=%d y=%d", 3);- Let's say that GCC changed its calling convention so that it pushed arguments on the stack in declaration order, so that the last argument is pushed last. How would you have to change
cprintfor its interface so that it would still be possible to pass it a variable number of arguments?
问题1。
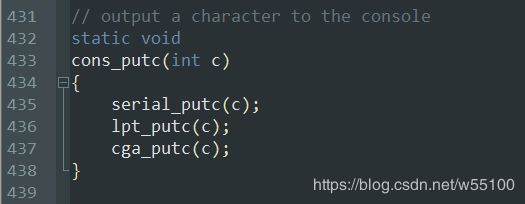
console.c定义了最基础的与console交互的接口,即如何在console里面打印1个字符。
再往下我就看不懂了,serial,lpt,cga这三个东西最终都是outb,属于处理器汇编范畴。
想继续了解可以看这篇博文http://www.cnblogs.com/fatsheep9146/p/5066690.html。
回答 what does consle.c export,它对外暴露的就是cputchar这个函数。
而printf.c的功能就是连接用户侧,读入用户的【格式字符串】和【欲打印内容】,然后把打印1个字符的能力,扩展成【按需打印多个字符】。
问题2.
可以在console.c这里找到。
为了帮助理解,我们还是要联系上下文。
上文有cga_putc函数,判断字符c是什么东西。
如果c是'\b'就退格,退格的实现方式是crt_pos,那么我们可以猜测crt_pos指向缓冲区最后一个元素所在位置。
如果c是'\n'就换行,换行的方式是crt_pos+=CRT_COLS 。可以合理猜测CRT_COLS就是显示区域的列数。
如果c是'\r'就移动到行首,实现方式是crt_pos-=(crt_pos % CRT_COLS) 。
那么我们可以结合日常经验,'\r\n'是换行+移动到行首,再次验证我们的猜测应该是正确的。
static void
cga_putc(int c)
{
	// if no attribute given, then use black on white
	if (!(c & ~0xFF))
		c |= 0x0700;

	switch (c & 0xff) {
	case '\b':
		if (crt_pos > 0) {
			crt_pos--;
			crt_buf[crt_pos] = (c & ~0xff) | ' ';
		}
		break;
	case '\n':
		crt_pos += CRT_COLS;
		/* fallthru */
	case '\r':
		crt_pos -= (crt_pos % CRT_COLS);
		break;
	case '\t':
		cons_putc(' ');
		cons_putc(' ');
		cons_putc(' ');
		cons_putc(' ');
		cons_putc(' ');
		break;
	default:
		crt_buf[crt_pos++] = c;		/* write the character */
		break;
	}

	// What is the purpose of this?
	if (crt_pos >= CRT_SIZE) {
		int i;

		memmove(crt_buf, crt_buf + CRT_COLS, (CRT_SIZE - CRT_COLS) * sizeof(uint16_t));
		for (i = CRT_SIZE - CRT_COLS; i < CRT_SIZE; i++)
			crt_buf[i] = 0x0700 | ' ';
		crt_pos -= CRT_COLS;
	}

	/* move that little blinky thing */
	outb(addr_6845, 14);
	outb(addr_6845 + 1, crt_pos >> 8);
	outb(addr_6845, 15);
	outb(addr_6845 + 1, crt_pos);
}
理解了什么是crt_pos和CRT_COLS,再来看↑代码的最后一段。
if crt_pos >= CRT_SIZE,说明【显示缓冲区】爆满了。
crt_buf指向显示缓冲区的开头位置。
看这句
memmove(crt_buf, crt_buf + CRT_COLS, (CRT_SIZE - CRT_COLS) * sizeof(uint16_t));我们需要把 crt_buf+CRT_COLS开始的, (CRT_SIZE-CRT_COLS)*size 个字节的内存,移动到crt_buf位置。
效果就是这样啦↓
移动完之后,还得把最后一行,即[CRT_SOZE-CRT_COLS, CRT_SIZE)这个区间的格子全部换成空白符 ' '。
for (i = CRT_SIZE - CRT_COLS; i < CRT_SIZE; i++)
			crt_buf[i] = 0x0700 | ' ';
由于我们整体上移了一行,所以buf区的光标也要上移。
crt_pos -= CRT_COLS;最后那一堆outb就是真正地向硬件打印出buf缓冲区的东西。
问题3
推荐我们看Lecture2 的notes,链接在此https://pdos.csail.mit.edu/6.828/2018/lec/l-x86.html,只要看gcc x86 calling conventions这节。
如果看不懂,可以看我写的这篇gcc x86 calling conventions。
也可以参考一下大神的这篇博文自己动手写printf -- 库函数printf的实现。
直接说结论,对cprintf函数(定义在kern/ptinf.c)而言,fmt是一个指针,指向"x %d, y %x, z %d\n"这个【格式字符串】。
而ap指向后面的变量列表var_list的起始地址,本例中可以理解为x的地址。
总之是利用一个函数内的所有东西大家都挤在一个栈区这个特点。
最后的变量先入栈,最前的变量最后入栈,于是就成了栈顶。
既然我们知道了第一个指针fmt的值,就很容易找到紧挨着的下一个位置ap的值,顺着ap一路找下去就能遍历整个var_list了。
int x = 1, y = 3, z = 4;
cprintf("x %d, y %x, z %d\n", x, y, z);
后半截让我们list很多很多东西的值加深理解,懒得弄了。
这篇博文有详细记录http://www.cnblogs.com/wuhualong/p/lab01_exercise08_formatted_printing_to_the_console.html
包括问题4~6都建议看这篇。
问题4
输出“He110 World”。
由于是little endian小端的机器,所以i = 0x00646c72,储存的时候是72 6c 64 00。
对应的ascii码就是 r l d
问题5
如果要求有2个%d,但是只传入一个数字3怎么办?
这就是c的暴力之处,就算你不严谨,但是没关系,我一样会把第一个数字3的地址+4Bit之后,将新的地址当成int来看,强行读取并打印。
各种越界,大家双双暴毙。
(处理器不会报错的,在c里面这种神操作是合法的。一般是由编译器来纠错,提醒你这里给的参数不够用。)
问题6
改变gcc压栈方式,in declaration order。 就是以声明的顺序,最早的变量最先入栈,到了栈底。
这样栈顶指针,最后就指向了最后一个变量。
此时可以添加一个计算变量总长度的参数size_t n。
我们拿到栈顶指针ap之后,先 (void *)fmt = ap - n。
就找到了格式化字符串的开头了。
于是一切照旧
终于到最后一个实验了
9其实不是一个实验,只是一个课外阅读任务。
Exercise 9. Determine where the kernel initializes its stack, and exactly where in memory its stack is located. How does the kernel reserve space for its stack? And at which "end" of this reserved area is the stack pointer initialized to point to?
The x86 stack pointer (esp register) points to the lowest location on the stack that is currently in use. Everything below that location in the region reserved for the stack is free. Pushing a value onto the stack involves decreasing the stack pointer and then writing the value to the place the stack pointer points to. Popping a value from the stack involves reading the value the stack pointer points to and then increasing the stack pointer. In 32-bit mode, the stack can only hold 32-bit values, and esp is always divisible by four. Various x86 instructions, such as call, are "hard-wired" to use the stack pointer register.
这个就是简单介绍x86的堆栈机制了。如果你看了我写的这篇gcc x86 calling conventions,或者本身已有基础可以略过。
The ebp (base pointer) register, in contrast, is associated with the stack primarily by software convention. On entry to a C function, the function's prologue code normally saves the previous function's base pointer by pushing it onto the stack, and then copies the current esp value into ebp for the duration of the function. If all the functions in a program obey this convention, then at any given point during the program's execution, it is possible to trace back through the stack by following the chain of saved ebp pointers and determining exactly what nested sequence of function calls caused this particular point in the program to be reached. This capability can be particularly useful, for example, when a particular function causes an assert failure or panic because bad arguments were passed to it, but you aren't sure who passed the bad arguments. A stack backtrace lets you find the offending function.
如果所程序都遵守calling convention,那么就很容易回溯所有函数的栈区基指针ebp。
因为根据规则,在一个子函数中,ebp必然指向保存着父函数ebp的位置。所以可以不断的把当前ebp位置的值取出来赋值给ebp来回到上一级函数。
实验10
Exercise 10. To become familiar with the C calling conventions on the x86, find the address of the
test_backtracefunction in obj/kern/kernel.asm, set a breakpoint there, and examine what happens each time it gets called after the kernel starts. How many 32-bit words does each recursive nesting level oftest_backtracepush on the stack, and what are those words?Note that, for this exercise to work properly, you should be using the patched version of QEMU available on the tools page or on Athena. Otherwise, you'll have to manually translate all breakpoint and memory addresses to linear addresses.
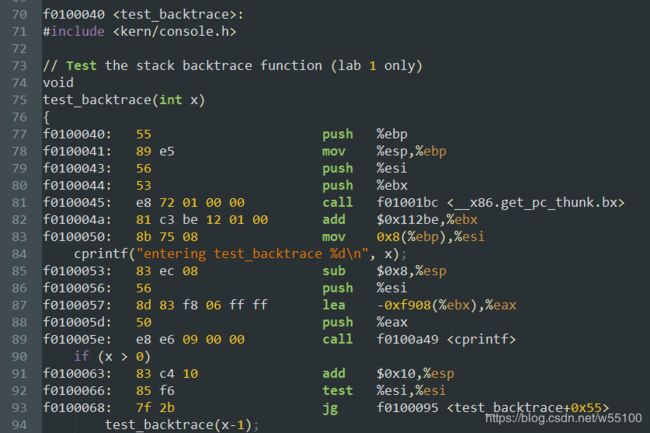
在kern/init.c里面找到源代码。
容易知道这是个类似递归的东西。
在 kernel.asm文件中可以找到test_backtrace的入口地址为f0100040。
打个断点轻松来到这里
下面的过程看了一下,就是个循环调用的机器码运作过程。
我在研究 calling conventions的时候已经搞过一次了。
直接看大神的记录吧。https://www.cnblogs.com/wuhualong/p/lab01_exercise10_test_backtrace.html
lab1完成。
//非常感谢JasonLeaster的文章,帮助了我许多https://blog.csdn.net/cinmyheart/article/details/39754269
//若有错误欢迎指出


