《TensorFlow技术解析与实战》——3.3 可视化的例子
本节书摘来异步社区《TensorFlow技术解析与实战》一书中的第3章,第3.3节,作者:李嘉璇,更多章节内容可以访问云栖社区“异步社区”公众号查看。
3.3 可视化的例子
词嵌入(word embedding)在机器学习中非常常见,可以应用在自然语言处理、推荐系统等其他程序中。下面我们就以Word2vec为例来看看词嵌入投影仪的可视化。
TensorFlow的Word2Vec有basic、optimised这两个版本,我们重点来看这两个版本的可视化表示。
3.3.1 降维分析
本节将以GitHub上的一段代码[3]为例,讲述可视化的思路。
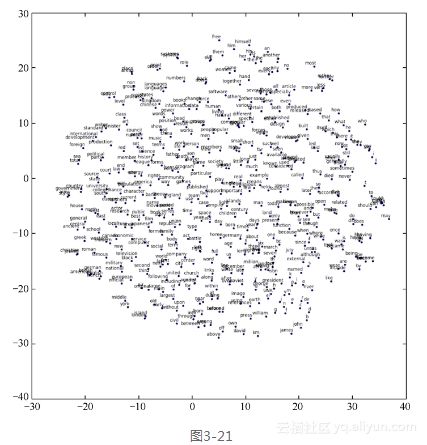
Word2vec采用text8[4]作为文本的训练数据集。这个文本中只包含a~z字符和空格,共27种字符。我们重点讲述产生的结果可视化的样子以及构建可视化的过程。这里我们采用的是Skip-gram模型,即根据目标词汇预测上下文。也就是说,给定n个词围绕着词w,用w来预测一个句子中其中一个缺漏的词c,以概率p(c|w)来表示。最后生成的用t-SNE降维呈现词汇接近程度的关系如图3-21所示。
在word2vec_basic.py中,从获得数据到最终得到可视化的结果的过程分为5步。
(1)下载文件并读取数据。主要是read_data函数,它读取输入的数据,输出一个list,里面的每一项就是一个词。
def read_data(filename):
  with zipfile.ZipFile(filename) as f:
    data = tf.compat.as_str(f.read(f.namelist()[0])).split()
  return data
这里的data就类似于['fawn', 'homomorphism', 'nordisk', 'nunnery']。
(2)建立一个词汇字典。这里首先建立了一个词汇字典,字典里是对应的词和这个词的编码。
vocabulary_size = 50000

def build_dataset(words):
  count = [['UNK', -1]]
  count.extend(collections.Counter(words).most_common(vocabulary_size - 1))
  dictionary = dict()
  for word, _ in count:
    dictionary[word] = len(dictionary)
  data = list()
  unk_count = 0
  for word in words:
    if word in dictionary:
      index = dictionary[word]
    else:
      index = 0  # dictionary['UNK']
      unk_count += 1
    data.append(index)
  count[0][1] = unk_count
  reverse_dictionary = dict(zip(dictionary.values(), dictionary.keys()))
  return data, count, dictionary, reverse_dictionary

data, count, dictionary, reverse_dictionary = build_dataset(words)
dictionary里存储的就是词与这个词的编码;reverse_dictionary是反过来的dictionary,对应的是词的编码与这个词;data是list,存储的是词对应的编码,也就是第一步中得到的词的list,转化为词的编码表示;count中存储的是词汇和词频,其中重复数量少于49 999个词,用'UNK'来代表稀有词。具体示例如下:
data [5239, 3084, 12, 6, 195, 2, 3137, 46, 59, 156]
count [['UNK', 418391], ('the', 1061396), ('of', 593677), ('and', 416629),
       ('one', 411764), ('in', 372201), ('a', 325873), ('to', 316376), ('zero', 264975),
           ('nine', 250430)]
dictionary {'fawn': 0, 'homomorphism': 1, 'nordisk': 2, 'nunnery': 3, 'chthonic':
             4, 'sowell': 5, 'sonja': 6, 'showa': 7, 'woods': 8, 'hsv': 9}
reverse_dictionary {0: 'fawn', 1: 'homomorphism', 2: 'nordisk', 3: 'nunnery', 4:
                     'chthonic', 5: 'sowell', 6: 'sonja', 7: 'showa', 8: 'woods', 9: 'hsv'}
(3)产生一个批次(batch)的训练数据。这里定义generate_batch函数,输入batch_size、num_skips和skip_window,其中batch_size是每个batch的大小,num_skips代表样本的源端要考虑几次,skip_windows代表左右各考虑多少个词,其中skip_windows*2=num_skips。最后返回的是batch和label,batch的形状是[batch_size],label的形状是[batch_size, 1],也就是用一个中心词来预测一个周边词。
举个例子。假设我们的句子是“我在写一首歌”,我们将每一个字用dictionary中的编码代替,就变成了[123, 3084, 12, 6, 195, 90],假设这里的window_size是3,也就是只预测上文一个词,下文一个词,假设我们的generate_batch函数从3084出发,源端重复2次,那么batch就是[3084 3084 12 12 6 6 195 195],3084的上文是123,下文是12;12的上文是3084,下文是6;6的上文是12,下文是195;195的上文是6,下文是90。因此,对应输出的label就是:
[[ 123]
 [12]
 [3084]
 [    6]
 [  12]
 [ 195]
 [   6]
 [   90]]
(4)构建和训练模型。这里我们构建一个Skip-gram模型,具体模型搭建可以参考Skip-gram的相关论文。执行结果如下:
Found and verified text8.zip
Data size 17005207 # 共有17005207个单词数
Most common words (+UNK) [['UNK', 418391], ('the', 1061396), ('of', 593677),
                            ('and', 416629), ('one', 411764)]
Sample data [5239, 3084, 12, 6, 195, 2, 3137, 46, 59, 156] ['anarchism', 'originated',
           'as', 'a', 'term', 'of', 'abuse', 'first', 'used', 'against']
3084 originated -> 5239 anarchism
3084 originated -> 12 as
12 as -> 3084 originated
12 as -> 6 a
6 a -> 195 term
6 a -> 12 as
195 term -> 6 a
195 term -> 2 of
Initialized
Average loss at step  0 :  263.743347168
Nearest to a: following, infantile, professor, airplane, retreat, implicated,
ideological, epstein,
Nearest to will: apokryphen, intercity, casta, nsc, commissioners, conjuring,
stockholders, bureaucrats,
Nearest to this: option, analgesia, quelled, maeshowe, comers, inevitably, kazan, burglary,
Nearest to in: embittered, specified, deicide, pontiff, omitted, edifice, levitt, cordell,
Nearest to world: intelligible, unguarded, pretext, cinematic, druidic, agm, embarks,
cingular,
Nearest to use: hab, tabula, estates, laminated, battle, loyola, arcadia, discography,
Nearest to from: normans, zawahiri, harrowing, fein, rada, incorrect, spandau, insolvency,
Nearest to people: diligent, tum, cour, komondor, lecter, sadly, barnard, ebony,
Nearest to it: fulfilled, referencing, paullus, inhibited, myra, glu, perpetuation,
theologiae,
Nearest to united: frowned, turkey, profusion, personifications, michelangelo,
sisters, okeh, claypool,
Nearest to new: infanta, fen, mizrahi, service, monrovia, mosley, taxonomy, year,
Nearest to seven: tilsit, prefect, phyla, varied, reformists, bc, berthe, acceptance,
Nearest to also: pri, navarrese, abandonware, env, plantinga, radiosity, oops, manna,
Nearest to about: lorica, nchen, closing, interpret, smuggler, viceroyalty, barsoom, caving,
Nearest to his: introduction, mania, rotates, switzer, elvis, warped, chilli,
etymological,
Nearest to and: robson, fun, paused, scent, clouds, insulation, boyfriend, agreeable,
Average loss at step  2000 :  113.878970229
Average loss at step  4000 :  53.0354625027
Average loss at step  6000 :  33.5644974816
Average loss at step  8000 :  23.246792558
Average loss at step  10000 :  17.7630081813
(5)用t-SNE降维呈现。这里我们将上一步训练的结果做了一个t-SNE降维处理,最终用Matplotlib绘制出图形,图形见图3-19。代码如下:
def plot_with_labels(low_dim_embs, labels, filename='tsne.png'):
  assert low_dim_embs.shape[0] >= len(labels), "More labels than embeddings"
  plt.figure(figsize=(18, 18))  # in inches
  for i, label in enumerate(labels):
    x, y = low_dim_embs[i, :]
    plt.scatter(x, y)
    plt.annotate(label,
                 xy=(x, y),
                 xytext=(5, 2),
                 textcoords='offset points',
                 ha='right',
                 va='bottom')

  plt.savefig(filename)

try:
  from sklearn.manifold import TSNE
  import matplotlib.pyplot as plt

  tsne = TSNE(perplexity=30, n_components=2, init='pca', n_iter=5000)
  plot_only = 500
  low_dim_embs = tsne.fit_transform(final_embeddings[:plot_only, :])
  labels = [reverse_dictionary[i] for i in xrange(plot_only)]
  plot_with_labels(low_dim_embs, labels)

except ImportError:
  print("Please install sklearn, matplotlib, and scipy to visualize embeddings.")
 ```

小知识

t-SNE是流形学习(manifold Learning)方法的一种。它假设数据是均匀采样于一个高维空间的低维流形,流形学习就是找到高维空间中的低维流形,并求出相应的嵌入映射,以实现维数约简或者数据可视化。流形学习方法分为线性的和非线性的两种。线性的流形学习方法如主成份分析(PCA),非线性的流形学习方法如等距特征映射(Isomap)、拉普拉斯特征映射(Laplacian eigenmaps,LE)、局部线性嵌入(Locally-linear embedding,LLE)等。
####3.3.2 嵌入投影仪
在3.2节中我们说到,在TensorBorad的面板中还有一个EMBEDDINGS面板,用于交互式可视化和分析高维数据。对于上面的word2vec_basic.py文件,我们只是做了一个降维分析,下面我们就来看看TensorBorad在词嵌入中的投影。这里采用官方GitHub开源实现上的例子[5]进行讲解。

这里我们自定义了两个操作(operator,OP):SkipgramWord2vec和NegTrainWord2vec。为什么需要自定义操作以及如何定义一个操作将在4.10节介绍。操作需要先编译,然后执行。这里采用Mac OS系统,在g++命令后加上-undefined dynamic_lookup参数:
TF_INC=$(python -c 'import tensorflow as tf; print(tf.sysconfig.get_include())')
g++ -std=c++11 -shared word2vec_ops.cc word2vec_kernels.cc -o word2vec_ops.so -fPIC -I $TF_INC -O2 -D_GLIBCXX_USE_CXX11_ABI=0
在当前目录下生成word2vec_ops.so文件,然后执行word2vec_optimized.py,生成的模型和日志文件位于/tmp/,我们执行:tensorboard --logdir=/tmp/
访问http://192.168.0.101:6006/,得到的EMBEDDINGS面板如图3-22所示。
 在EMBEDDINGS面板左侧的工具栏中,可以选择降维的方式,有T-SNE、PCA和CUSTOM的降维方式,并且可以做二维/三维的图像切换。例如,切换到t-SNE降维工具,可以手动调整Dimension(困惑度)、Learning rate(学习率)等参数,最终生成10 000个点的分布,如图3-23所示。
 在EMBEDDINGS面板的右侧,可以采用正则表达式匹配出某些词,直观地看到词之间的余弦距离或欧式距离的关系,如图3-24所示。
 任意选择一个点,如8129,选择“isolate 101 points”按钮,将会展示出100个在空间上最接近被选择点的词,也可以调整展示的词的数量,如图3-25所示。

