本文首发于“生信补给站”:https://mp.weixin.qq.com/s/lpkWwrLNtkLH8QA75X5STw
生存分析作为分析疾病/癌症预后的出镜频率超高的分析手段,而其结果展示的KM曲线也必须拥有姓名和颜值!
生存分析相关推文:
生存分析和KM曲线:R|生存分析(1)
分析结果一键输出:R|生存分析-结果整理
时间依赖生存分析:R|timeROC-分析
一 数据和R包
为方便,使用内置lung数据集
#载入所需的R包
library("survival")
library("survminer")
#载入并查看数据集
data("lung")
head(lung)
  inst time status age sex ph.ecog ph.karno pat.karno meal.cal wt.loss
1    3  306      2  74   1       1       90       100     1175      NA
2    3  455      2  68   1       0       90        90     1225      15
3    3 1010      1  56   1       0       90        90       NA      15
4    5  210      2  57   1       1       90        60     1150      11
5    1  883      2  60   1       0      100        90       NA       0
6   12 1022      1  74   1       1       50        80      513       0
二 原生KM曲线
#构建模型
fit <- survfit(Surv(time, status) ~ sex, data=lung)
#绘制原生KM曲线
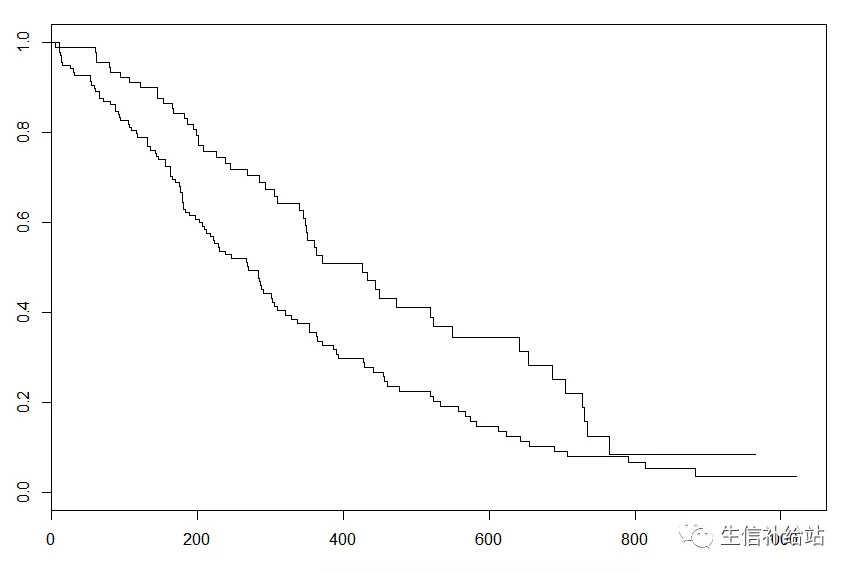
plot(fit)
可以很容易的发现与文献中的差异,可优化:
1)区分两条线的颜色和legend
2)坐标轴,标题,主题优化
3)Risk table
4)P值,OR值,CI值等注释信息
三 优化KM曲线
1 survminer绘制KM曲线
p1 <- ggsurvplot(fit)
P1
呐,线的颜色可以和性别对应起来了,Q1解决!
2 坐标轴,标题,主题优化
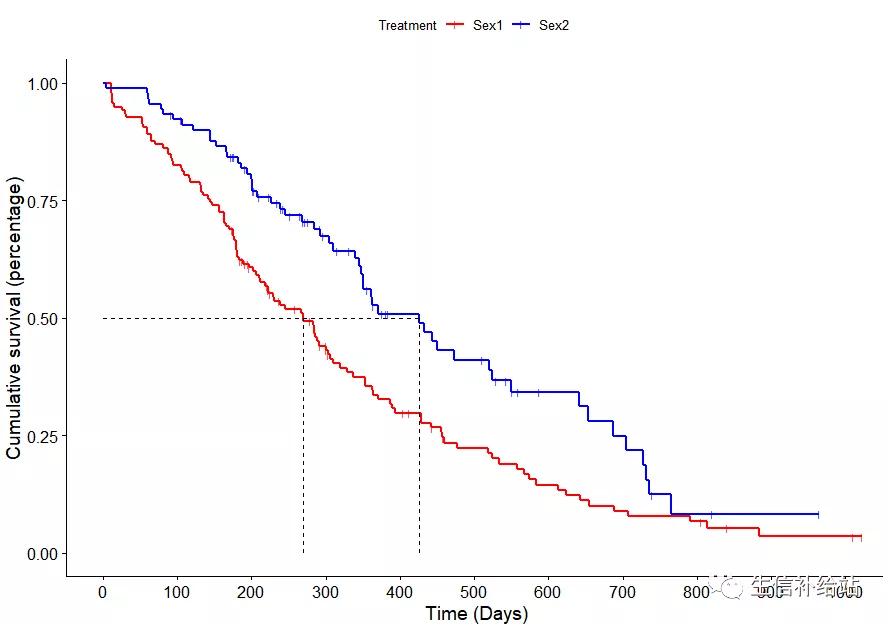
p2 <- ggsurvplot(fit, data = lung,
           surv.median.line = "hv", #添加中位生存曲线
           palette=c("red", "blue"),  #更改线的颜色
           legend.labs=c("Sex1","Sex2"), #标签
           legend.title="Treatment",
           title="Overall survival", #标题
           ylab="Cumulative survival (percentage)",xlab = " Time (Days)", #更改横纵坐标
           censor.shape = 124,censor.size = 2,conf.int = FALSE, #删失点的形状和大小
           break.x.by = 100#横坐标间隔
           )
P2
以上基本就完成了KM曲线颜色,线型大小,标签,横纵坐标,标题,删失点等的修改,Q2搞定!
注意中位生存时间表示50 %的个体尚存活的时间,而不是生存时间的中位数
3 Risk Table
p3 <- ggsurvplot(fit, data = lung,
           surv.median.line = "hv", #添加中位生存曲线
           palette=c("red", "blue"),
           legend.labs=c("Sex1","Sex2"), #标签
           legend.title="Treatment",
           title="Overall survival",
           ylab="Cumulative survival (percentage)",xlab = " Time (Days)", #更改横纵坐标
           censor.shape = 124,censor.size = 2,conf.int = FALSE,
           break.x.by = 100,
           risk.table = TRUE,tables.height = 0.2,
           tables.theme = theme_cleantable(),
           ggtheme = theme_bw())
p3
注 tables.height可调整为看起来“舒服”的高度
根据risk table 可以看出关键点的当前状态,Q3摆平!
4 添加注释信息
1)添加KM的P值
P4 <- ggsurvplot(fit, data = lung,
           pval = TRUE,#添加P值
           pval.coord = c(0, 0.03), #调节Pval的位置
           surv.median.line = "hv", #添加中位生存曲线
           palette=c("red", "blue"),
           legend.labs=c("Sex1","Sex2"), #标签
           legend.title="Treatment",
           title="Overall survival",
           ylab="Cumulative survival (percentage)",xlab = " Time (Days)", #更改横纵坐标
           censor.shape = 124,censor.size = 2,conf.int = FALSE,
           break.x.by = 100,
           risk.table = TRUE,tables.height = 0.2,
           tables.theme = theme_cleantable(),
           ggtheme = theme_bw())
P4
pval.coord可以调节P值得位置
2)添加COX回归hazard ratio值等相关信息**
###添加COX回归hazard ratio值相关信息
res_cox<-coxph(Surv(time, status) ~sex, data=lung)
p3$plot = p3$plot + ggplot2::annotate("text",x = 50, y = 0.15,
                             label = paste("HR :",round(summary(res_cox)$conf.int[1],2))) + ggplot2::annotate("text",x = 50, y = 0.10,
                    label = paste("(","95%CI:",round(summary(res_cox)$conf.int[3],2),"-",round(summary(res_cox)$conf.int[4],2),")",sep = ""))+
  ggplot2::annotate("text",x = 50, y = 0.05,
                    label = paste("P:",round(summary(res_cox)$coef[5],4)))
p3
3)添加其他信息
可类似上述annotation得方式,使用ggplot2添加文字,箭头,公式等其他信息,下面为你可能需要的ggplot2的几个知识:
ggplot2|详解八大基本绘图要素
ggplot2|theme主题设置,详解绘图优化-“精雕细琢”
ggplot2 |legend参数设置,图形精雕细琢
ggplot2|ggpubr进行“paper”组图合并
参考资料:
◆ ◆ ◆ ◆ ◆
精心整理(含图版)|R语言生信分析,可视化,你要的全拿走,建议收藏!


