吴恩达深度学习猫咪识别(一)
准备
1.逻辑回归在深度学习中简介
- 逻辑回归是一种用在监督学习(supervised
learning)中解决输出结果为离散值,例如y=1,y=0的一种学习算法。进行逻辑回归的目的,它可以使训练数据的标签值与预测出来的值之间的误差最小化。 - 例:实现图片的识别 Cat vs No-cat,(二分类问题)
RGB三色混合可以组成任意颜色且电脑中图片以RGB编码方式存贮,每张图片都有像素,n_pixel*n_pixel个像素点组成了一张 图片。

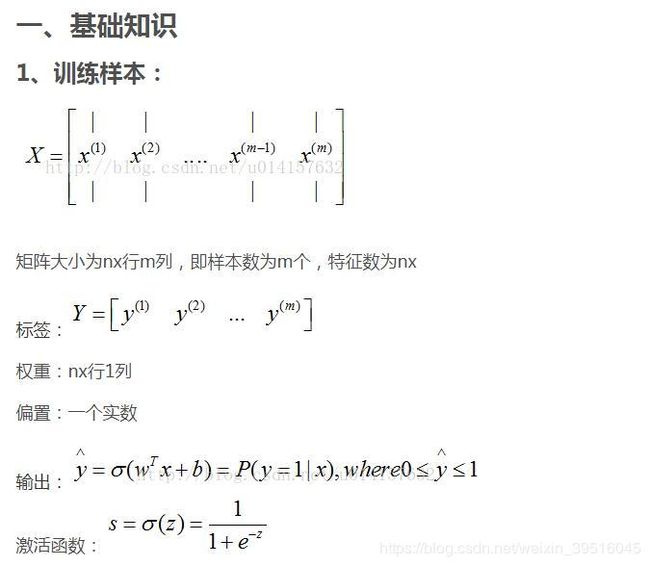
因此把可以每一张图片用一个向量X俩表示,上图可以如下表示:

其中red=6464,green=6464,blue=64*64,x是一个(12288,1)的矩阵。
二、程序cat vs not cat
为了简化流程,吴恩达老师已经给出了训练集和测试集数据以.h5格式给出(.h5格式是使用h5py库生产数据文件类型),处理完成后会返回5个矩阵分别为:训练集X矩阵(train_set_x_orig), 训练集Y矩阵(train_set_y_orig ),测试集X矩阵(test_set_x_orig),测试集Y矩阵(test_set_y_orig),类别( classes:喵与非喵),相当于吴恩达老师已经把所有图片全部转化为我们可以直接使用的数字矩阵。
lr-util.py:载入数据
import numpy as np
import h5py


def load_dataset():
    train_dataset = h5py.File('datasets/train_catvnoncat.h5', "r")
    #   209 images for train ,pixels = 64*64,RGB 3 channels
    #   train_set_x_orig.shape = (209,64,64,3)
    train_set_x_orig = np.array(train_dataset["train_set_x"][:])  # your train set features,
    train_set_y_orig = np.array(train_dataset["train_set_y"][:])  # your train set labels

    #   50 images for test ,pixels = 64*64,RGB 3 channels
    #   test_set_x_orig.shape = (50,63,63,3)
    test_dataset = h5py.File('datasets/test_catvnoncat.h5', "r")
    test_set_x_orig = np.array(test_dataset["test_set_x"][:])  # your test set features
    test_set_y_orig = np.array(test_dataset["test_set_y"][:])  # your test set labels

    #   classes.shape = 2
    classes = np.array(test_dataset["list_classes"][:])  # the list of classes

    # train_set_y_orig = 209, test_set_y_orig = 50
    train_set_y_orig = train_set_y_orig.reshape((1, train_set_y_orig.shape[0]))
    test_set_y_orig = test_set_y_orig.reshape((1, test_set_y_orig.shape[0]))
    return train_set_x_orig, train_set_y_orig, test_set_x_orig, test_set_y_orig, classes
训练图片:209张6464像素RGB 3通道的图片
测试图片:50张6464像素RGB 3通道的图片
train_set_x_orig是一个(209,64,64,3)维度的数组(相当于4D),
train_set_y_orig是一个(209,)的数组,即一维数组
np.reshap(x,y):把一个(n,m)的数组变成(x,y)的数组
np.shape[n]:计算维度n有多少个组数。a.shape=(3,26,51,23),a.shape[0]=3,a.shape[2]=51
logistics.py:算法实现
- 库导入
import numpy as np
from lr_util import load_dataset
import scipy
import matplotlib.pyplot as plt
- 数据导入
# load data
train_set_x_orig, train_set_y, test_set_x_orig, test_set_y, classes = load_dataset()

m_train = train_set_x_orig.shape[0]  # num for train  209
m_test = test_set_x_orig.shape[0]  # num for test 50
num_px = train_set_x_orig.shape[1]  # image pixels 64*64 length = width

# image is 3 channels ,set to 1 dimension vector
#   train_set_x_flatten.shape = (64*64*3,209),test_set_x_flatten.shape = (64*64*3,50)
train_set_x_flatten = train_set_x_orig.reshape(m_train, -1).T
test_set_x_flatten = test_set_x_orig.reshape(m_test, -1).T
例:a.shape=(3,5),a.reshape(-1,x)->a.shape=(15/x,x) 或 a.reshape(y,-1)->a.shape(y,15)
- 图像的归一化
train_set_x = train_set_x_flatten / 255.
test_set_x = test_set_x_flatten / 255.
- 激励函数:sigmoid函数
def sigmoid(z):
    """Function sigmoid()"""
    return 1/(1+np.exp(-z))
初始化w和b
def initialize_with_zeros(dimension):
    """parameters   w , b  init """
    w = np.zeros((dimension, 1))  # weights
    # print(w)
    # while True:
    #   a = 0
    b = 0  # bias
    assert (w.shape == (dimension, 1))
    assert (isinstance(b, float) or isinstance(b, int))
    return w, b
- 传播函数,用于计算梯度下降法中的两个重要参数dw和db,及代价函数(Cost
Function),根据逻辑回归算法我们采用的代价函数为:J(w,b)=1m∑i=1mL(y(i),y(i))=−1m∑i=1m[y(i)logy(i)+(1−y(i))log(1−y^(i))]
def propagate(w, b, x_plus, y_plus):
    """
    :param w: weights, a numpy array of size (num_px * num_px * 3, 1)
    :param b: bias, a scalar
    :param x_plus: data of size (num_px * num_px * 3, number of examples)
    :param y_plus: true "label" vector (containing 0 if non-cat, 1 if cat) of size (1, number of examples)
    :return:cost -- negative log-likelihood cost for logistic regression
            dw -- gradient of the loss with respect to w, thus same shape as w
            db -- gradient of the loss with respect to b, thus same shape as b
    """
    # x_plus.shape = (12288, 209)
    m = x_plus.shape[1]  # num of examples
    a_plus = sigmoid(np.dot(w.T, x_plus) + b)  # activation function
    cost = -1 / m * np.sum(np.dot(y_plus, np.log(a_plus).T) + np.dot((1 - y_plus), np.log(1-a_plus).T))
    dw = np.dot(x_plus, (a_plus - y_plus).T) / m
    db = np.sum(a_plus - y_plus) / m

    assert(dw.shape == w.shape)
    assert (db.dtype == float)
    cost = np.squeeze(cost)
    assert(cost.shape == ())

    grads = {
            "dw": dw,
            "db": db
            }
    return grads, cost
np.squeeze:删除np.shape[x] = 1 的那一个维度
np.dot(X,Y):数组X*数组Y
- 最优化,利用梯度下降进行反复迭代,获取最终的优化参数w和b
def optimize(w, b, x_plus, y_plus, num_iterations, learning_rate, print_cost=False):
    """
    This function optimizes w and b by running a gradient descent algorithm
    Arguments:
    :param w:weights, a numpy array of size (num_px * num_px * 3, 1)
    :param b:bias, a scalar
    :param x_plus:data of shape (num_px * num_px * 3, number of examples)
    :param y_plus:true "label" vector (containing 0 if non-cat, 1 if cat) (1, number of examples)
    :param num_iterations:number of iterations of the optimization loop
    :param learning_rate:learning rate of the gradient descent update rule
    :param print_cost:True to print the loss every 100 steps
    :return:
    params -- dictionary containing the weights w and bias b
    grads -- dictionary containing the gradients of the weights and bias with respect to the cost function
    costs -- list of all the costs computed during the optimization, this will be used to plot the learning curve
    """
    costs = []
    for i in range(num_iterations):
        grads, cost = propagate(w, b, x_plus, y_plus)
        dw = grads["dw"]
        db = grads["db"]
        w = w - learning_rate * dw  # update weights
        b = b - learning_rate * db  # update bias
        if i % 100 == 0:
            costs.append(cost)
        if print_cost and i % 100 == 0:
            print("cost after iteration %i:%f" % (i, cost))
    params = {
              "w": w,
              "b": b
            }

    grads = {
             "dw": dw,
             "db": db
            }
    return params, grads, costs
- 预测函数,根据优化函数获得的w和b,对输入样本集进行预测,当预测的概率大于0.5为猫。
def predict(w, b, x_plus):
    """
    Predict whether the label is 0 or 1 using learned logistic regression parameters (w, b)
    :param w:weights, a numpy array of size (num_px * num_px * 3, 1)
    :param b:bias, a scalar
    :param x_plus:data of size (num_px * num_px * 3, number of examples)
    :return:your_prediction -- a numpy array (vector) containing all predictions (0/1) for the examples in X
    """
    m = x_plus.shape[1]  # num of examples
    your_prediction = np.zeros((1, m))
    # print(w.shape)
    # #  print(x_plus.shape)
    # while True:


    w = w.reshape(x_plus.shape[0], 1)
    a_plus = sigmoid(np.dot(w.T, x_plus) + b)

    for i in range(a_plus.shape[1]):
        if a_plus[:, i] > 0.5:
            your_prediction[:, i] = 1
        else:
            your_prediction[:, i] = 0

    return your_prediction
- 封装打包,定义损失函数(Loss Fuction)评价模型精度。
def model(x_train, y_train, x_test, y_test, num_iterations=2000, learning_rate=0.5, print_cost=False):
    """
    Builds the logistic regression model by calling the function you've implemented previously
    Arguments:
    :param x_train -- training set represented by a numpy array of shape (num_px * num_px * 3, m_train)
    :param y_train -- training labels represented by a numpy array (vector) of shape (1, m_train)
    :param x_test -- test set represented by a numpy array of shape (num_px * num_px * 3, m_test)
    :param y_test -- test labels represented by a numpy array (vector) of shape (1, m_test)
    :param num_iterations -- hyperparameter representing the number of iterations to optimize the parameters
    :param learning_rate -- hyperparameter representing the learning rate used in the update rule of optimize()
    :param print_cost -- Set to true to print the cost every 100 iterations
    Returns:
    d -- dictionary containing information about the model.
    """
    w, b = initialize_with_zeros(64 * 64 * 3)  # parameters init
    parameters, grads, costs = optimize(w, b, x_train, y_train, num_iterations, learning_rate, print_cost=False)

    w = parameters["w"]
    b = parameters["b"]

    y_prediction_test = predict(w, b, x_test)
    y_prediction_train = predict(w, b, x_train)

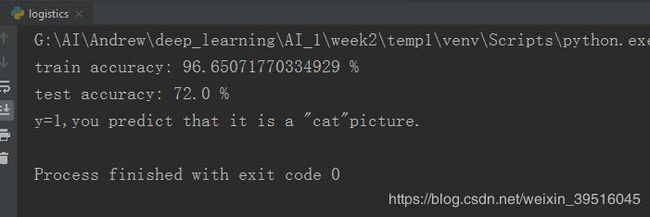
    print("train accuracy: {} %".format(100 - np.mean(np.abs(y_prediction_train - y_train)) * 100))
    print("test accuracy: {} %".format(100 - np.mean(np.abs(y_prediction_test - y_test)) * 100))
    d = {"costs": costs,
         "Y_prediction_test": y_prediction_test,
         "Y_prediction_train": y_prediction_train,
         "w": w,
         "b": b,
         "learning_rate": learning_rate,
         "num_iterations": num_iterations}
    return d
- 模型测试
d = model(train_set_x, train_set_y, test_set_x, test_set_y, num_iterations=1000, learning_rate=0.005, print_cost=True)
可视化测试
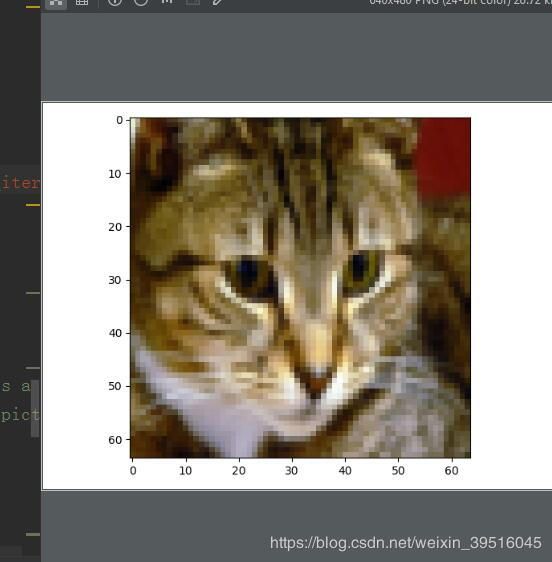
提取数据集里面的图片,并显示出来
index <=50
index = 10
a_image = test_set_x[:, index].reshape((num_px, num_px, 3))
plt.imshow(a_image)
plt.show()
print('y=' + str(test_set_y[0, index]) + ",you predict that it is a \"" + classes[
    int(d['Y_prediction_test'][0, index])].decode('utf-8') + "\"picture.")

使用imshow()函数将测试集中的某个图片及分类结果打印出来,进行肉眼判断
数据集链接:
https://pan.baidu.com/s/1s3edS-79VL468IFdF7hx6w 密码:qoqx
- PS:如何安装库(python大神请跳过)
电脑装了网卡驱动,用手机热点给电脑开的流量,为了节省流量所以在官网上直接下载库并保存下来。
库下载网址:https://pypi.org/
win+R键 打开CMD进入,在你的建工程文件夹里面找到pip3.7.exe(不同版本的解释器对应的exe不同,可能是pip3.5.exe),把pip3.7.exe直接拖到


然后输入install numpy-1.16.3-cp37-cp37m-win_amd64.whl 回车等待安装完成(下载的库要放到C:\Users\Administrator里面来)

安装成功


