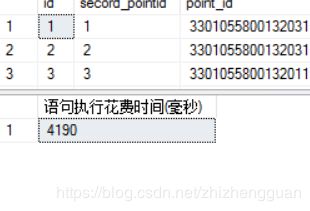
查看sql语句的执行时间
- 方法一:
declare @d datetime
set @d=getdate()
/*你的SQL脚本开始*/
SELECT * FROM pointInfo
/*你的SQL脚本结束*/
select [语句执行花费时间(毫秒)]=datediff(ms,@d,getdate())
- 方法二
SET STATISTICS PROFILE ON
SET STATISTICS io ON
SET STATISTICS time ON
go
SELECT * FROM pointInfo
go
SET STATISTICS profile OFF
SET STATISTICS io OFF
SET STATISTICS time OFF
1、查找目前SQL Server所执行的SQL语法,并展示资源情况:
SELECT  s2.dbid ,
         DB_NAME(s2.dbid) AS [数据库名] ,
         --s1.sql_handle ,
         ( SELECT TOP 1
                     SUBSTRING(s2.text, statement_start_offset / 2 + 1,
                               ( ( CASE WHEN statement_end_offset = -1
                                        THEN ( LEN(CONVERT(NVARCHAR(MAX), s2.text))
                                               * 2 )
                                        ELSE statement_end_offset
                                   END ) - statement_start_offset ) / 2 + 1)
         ) AS [语句] ,
         execution_count AS [执行次数] ,
         last_execution_time AS [上次开始执行计划的时间] ,
         total_worker_time AS [自编译以来执行所用的 CPU 时间总量(微秒)] ,
         last_worker_time AS [上次执行计划所用的 CPU 时间(微秒)] ,
         min_worker_time AS [单次执行期间曾占用的最小 CPU 时间(微秒)] ,
         max_worker_time AS [单次执行期间曾占用的最大 CPU 时间(微秒)] ,
         total_logical_reads AS [总逻辑读] ,
         last_logical_reads AS [上次逻辑读] ,
         min_logical_reads AS [最少逻辑读] ,
         max_logical_reads AS [最大逻辑读] ,
         total_logical_writes AS [总逻辑写] ,
         last_logical_writes AS [上次逻辑写] ,
         min_logical_writes AS [最小逻辑写] ,
         max_logical_writes AS [最大逻辑写]
 FROM    sys.dm_exec_query_stats AS s1
         CROSS APPLY sys.dm_exec_sql_text(sql_handle) AS s2
 WHERE   s2.objectid IS NULL
 ORDER BY last_worker_time DESC
2、展示耗时查询:
-- List expensive queries
 DECLARE @MinExecutions int;
 SET @MinExecutions = 5

 SELECT EQS.total_worker_time AS TotalWorkerTime
       ,EQS.total_logical_reads + EQS.total_logical_writes AS TotalLogicalIO
       ,EQS.execution_count As ExeCnt
       ,EQS.last_execution_time AS LastUsage
       ,EQS.total_worker_time / EQS.execution_count as AvgCPUTimeMiS
       ,(EQS.total_logical_reads + EQS.total_logical_writes) / EQS.execution_count
        AS AvgLogicalIO
       ,DB.name AS DatabaseName
       ,SUBSTRING(EST.text
                 ,1 + EQS.statement_start_offset / 2
                 ,(CASE WHEN EQS.statement_end_offset = -1
                        THEN LEN(convert(nvarchar(max), EST.text)) * 2
                        ELSE EQS.statement_end_offset END
                  - EQS.statement_start_offset) / 2
                 ) AS SqlStatement
       -- Optional with Query plan; remove comment to show, but then the query takes !!much longer time!!
       --,EQP.[query_plan] AS [QueryPlan]
 FROM sys.dm_exec_query_stats AS EQS
      CROSS APPLY sys.dm_exec_sql_text(EQS.sql_handle) AS EST
      CROSS APPLY sys.dm_exec_query_plan(EQS.plan_handle) AS EQP
      LEFT JOIN sys.databases AS DB
          ON EST.dbid = DB.database_id
 WHERE EQS.execution_count > @MinExecutions
       AND EQS.last_execution_time > DATEDIFF(MONTH, -1, GETDATE())
 ORDER BY AvgLogicalIo DESC
         ,AvgCPUTimeMiS DESC
3、当前进程及其语句:
复制代码
-- Current processes and their SQL statements
 SELECT PRO.loginame AS LoginName
       ,DB.name AS DatabaseName
       ,PRO.[status] as ProcessStatus
       ,PRO.cmd AS Command
       ,PRO.last_batch AS LastBatch
       ,PRO.cpu AS Cpu
       ,PRO.physical_io AS PhysicalIo
       ,SES.row_count AS [RowCount]
       ,STM.[text] AS SQLStatement
 FROM sys.sysprocesses AS PRO
      INNER JOIN sys.databases AS DB
          ON PRO.dbid = DB.database_id
      INNER JOIN sys.dm_exec_sessions AS SES
         ON PRO.spid = SES.session_id
      CROSS APPLY sys.dm_exec_sql_text(PRO.sql_handle) AS STM
 WHERE PRO.spid >= 50  -- Exclude system processes
 ORDER BY PRO.physical_io DESC
         ,PRO.cpu DESC;
复制代码


4、存储过程执行情况:

复制代码
-- Stored Procedure Execution Statistics
 SELECT ISNULL(DBS.name, '') AS DatabaseName
       ,OBJECT_NAME(EPS.object_id, EPS.database_id) AS ObjectName
       ,EPS.cached_time AS CachedTime
       ,EPS.last_elapsed_time AS LastElapsedTime
       ,EPS.execution_count AS ExecutionCount
       ,EPS.total_worker_time / EPS.execution_count AS AvgWorkerTime
       ,EPS.total_elapsed_time / EPS.execution_count AS AvgElapsedTime
       ,(EPS.total_logical_reads + EPS.total_logical_writes)
        / EPS.execution_count AS AvgLogicalIO
 FROM sys.dm_exec_procedure_stats AS EPS
      LEFT JOIN sys.databases AS DBS
          ON EPS.database_id = DBS.database_id
 ORDER BY AvgWorkerTime DESC;
复制代码


5、开销较大的查询:

复制代码
/*
 开销较大的查询
 */
 SELECT  ss.SUM_execution_count ,
         t.text ,
         ss.SUM_total_elapsed_time ,
         ss.sum_total_worker_time ,
         ss.sum_total_logical_reads ,
         ss.sum_total_logical_writes
 FROM    ( SELECT    S.plan_handle ,
                     SUM(s.execution_count) SUM_Execution_count ,
                     SUM(s.total_elapsed_time) SUM_total_elapsed_time ,
                     SUM(s.total_worker_time) SUM_total_worker_time ,
                     SUM(s.total_logical_reads) SUM_total_logical_reads ,
                     SUM(s.total_logical_writes) SUM_total_logical_writes
           FROM      sys.dm_exec_query_stats s
           GROUP BY  S.plan_handle
         ) AS ss
         CROSS APPLY sys.dm_exec_sql_text(ss.plan_handle) t
 ORDER BY sum_total_logical_reads DESC
https://www.cnblogs.com/feng-yuan/p/6827895.html

