阿里云日志服务是针对日志类数据的一站式服务,您只需要将精力集中在日志分析上,过程中数据采集、对接各种存储计算、数据索引和查询等其他工作都可以通过配置日志服务来自动完成。
在结果分析可视化上,除了使用自带Dashboard外,还支持DataV、Grafana、Tableua、QuickBI等对接方式。本文主要通过Grafana示例演示如何通过日志服务对Nginx日志进行分析与可视化。
- 流程架构
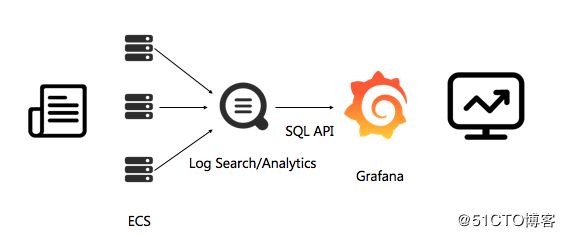
日志从收集到分析的流程架构如下:
- 配置流程
1). 日志数据采集。日志服务采集 logtail 进行日志采集。
2). 索引设置与控制台查询配置。重设索引,根据采集到Nginx的log字段进行指定字段查询。这里采集到Nginx日志格式非默认格式,根据需求已进行单独处理且为JSON格式。日志服务中查询分析已进行指定字段设置:
3). 安装Grafana插件,将实时查询SQL转化为视图。
接下来主要操作步骤3,前提是步骤1、2已经完成,能在日志服务控制台能查询到log。 - 配置步骤
- Grafana安装
Centos 7环境安装,详细安装操作请参考 https://grafana.com/docs/grafana/latest/installation/rpm/
Grafana安装版本:Grafana v6.4.4 - 安装日志服务插件
执行以下命令安装插件,并重启grafana-server。cd /var/lib/grafana/plugins/ git clone https://github.com/aliyun/aliyun-log-grafana-datasource-plugin systemctl restart grafana-server - 配置日志数据源
在Grafana首页左测找到Configuration配置项,选择 Data Sources。
单击右上角的Add data source,添加新的数据源。使用Grafana和阿里云日志服务进行日志可视化分析。
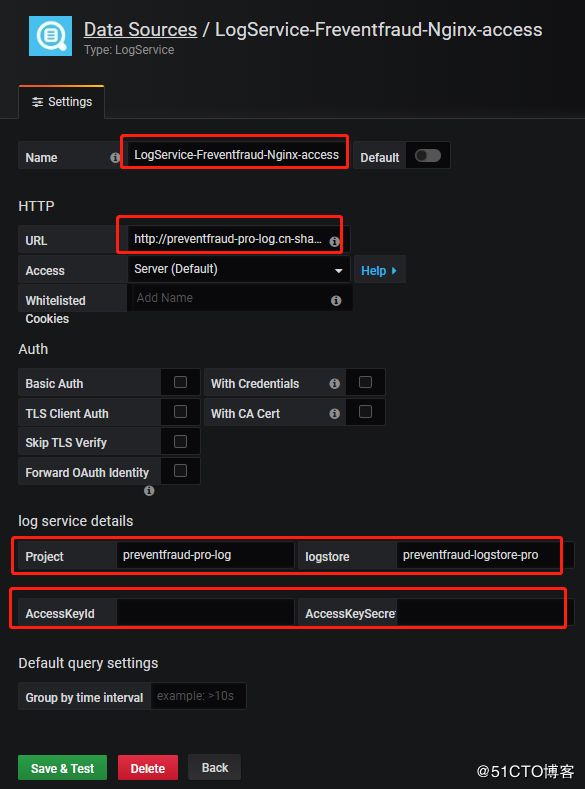
配置如下:
配置内容:
Name 自定义一个新数据源的名称。
Url 输入样例:http://dashboard-demo.cn-hangzhou.log.aliyuncs.com ,dashboard-demo是project名称,cn-hangzhou.log.aliyuncs.com是project所在地域的endpoint,在配置自己的数据源时,需要替换成自己的project和region地址。
log service details 日志服务详细配置,分别填写Project和Logstore,以及具备读取权限的AccessKey。AccessKey可以是主账号的AccessKey,也可以是子帐号的AccessKey。
配置完成后单击Add,即可完成添加DataSource。Configuration配置项里 Data Sources查看已配置好的数据源。
- 添加Dashboard
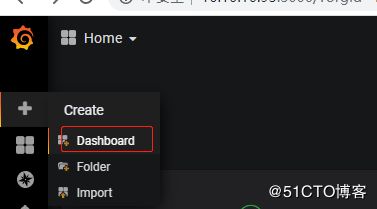
单击打开左上角菜单,选择"+"的Create项,单机Dashboards新加一个Dashboard。
4.1 配置PV、UV
a. 进入新加的Dashboard,左上角找到“Add Panel”。
b. 在该Panel中单机 “Add Query”,在 Query 中选择刚添加的数据源。
c. 找到右侧 Add Query,添加一新Query,在Query中输入✳ | select approx_distinct(client_ip) as uv, count(1) as pv, __time__ - __time__% 60 as time group by time order by time limit 1000Y - column输入:pv,uv
X - column [time]输入:time
这块日志服务SQL语句,先确保能在阿里日志查询分析控制台能查询通过,有数据输出,无语法错误,否则在Grafana无数据图形显示。
说明:
approx_distinct(client_ip):估算 client_ip 列的唯一值的个数。__time__:日志服务每条日志中内置的时间类型。灵活的时间维度统计,数学取模方法分组。__time_ - __time_ % 60表示按1分钟进行取模,即1分钟跨度显示。
d. 在 Visualization 中,Grafana可以支持多重类型的视图。对于PV,UV数据,在标签栏中单击Graph,创建一个Graph视图。
e. General中Title修改该Panel的名称,这里统计PV、UV,相应的名称修改为PV、UV。
f. 最后一项Alert,暂时不设置报警通知,如果要设置报警通知,在该Panel中单击Create Alert。在Notifications配置报警通知。
4.2 配置出入网带宽
参考4.1 配置PV、UV,使用同样的方法添加出入网带宽的流量。✳ | select sum(size) as net_out, sum(request_length) as net_in, __time__ -__time__% 60 as time group by time order by time limit 1000Y - column输入:net_in,net_out
X - column [time]输入:time
4.3 不同HTTP方法的占比
✳ | select count(1) as pv, split_part(request,' ',1) as request group by requestY - column输入:request,pv
X - column [time]输入:pie
4.4 不同HTTP状态码占比
✳ | select count(1) as pv, status group by statusY - column输入:status,pv
X - column [time]输入:pie
4.5 热门来源页面
✳ | select count(1) as pv, referer group by referer order by pv desc limit 10Y - column输入:referer,pv
X - column [time]输入:pie
4.6 延时最高页面
✳ | select split_part(request,' ',2) as top_latency_url, request_time group by top_latency_url,request_time order by request_time desc limit 20Y - column输入:top_latency_url, request_time
X - column [time]保持为空。
4.7 热门页面
✳ | select count(1) as pv, split_part(request,' ',2) as path group by path order by pv desc limit 10Y - column输入:path,pv
X - column [time]保持为空。
4.8 前后端平均延时
✳ | select avg(request_time) as response_time, avg(upstream_time) as upstream_response_time, __time__ -__time__% 60 as time group by time order by time limit 1000Y - column输入:upstream_response_time,response_time
X - column [time]输入:time
4.9 客户端统计
✳ | select count(1) as pv, case when regexp_like(agent , 'okhttp') then 'okhttp' when regexp_like(agent , 'iPhone') then 'iPhone' when regexp_like(agent , 'Android') then 'Android' else 'unKnown' end as agent group by agent order by pv desc limit 10Y - column输入:agent,pv
X - column [time]输入:pie
4.10 各省份占比统计
✳ | select ip_to_province(client_ip) as province, count(1) as pv group by province HAVING ip_to_province(client_ip) <> '-1' order by pv desc limit 10日志IP地理函数 ip_to_province(client_ip) 对无效IP,会返回”-1“。针对这块用 HAVING 过滤掉。
Y - column输入:province,pv
X - column [time]输入:pie
4.11 各城市占比统计
✳ | select ip_to_city(client_ip) as city, count(1) as pv group by city HAVING ip_to_city(client_ip) <> '-1' and ip_to_city(client_ip) <> '内网IP' order by pv desc limit 10Y - column输入:city,pv
X - column [time]输入:pie
4.12 保存和发布Dashboard
单击页面上方的保存按钮,发布Dashboard。 - 查看Dashboard结果
打开Dashboard首页查看效果。
以上文档内容参考了:https://help.aliyun.com/document_detail/60952.html
- Grafana安装