matplotlib(五)排版布局
网格布局目录
subplots()
最常见的网格排版方式,一次性定好所有Axes
GridSpec
复杂网格排列
SubplotSpec
为给定GridSpec中子图指定位置
subplot2grid()
类似于subplot(),但使用基于0的索引并允许子图占据多个单元格。
subplots
import matplotlib.pyplot as plt
import matplotlib.gridspec as gridspec

fig1, f1_axes = plt.subplots(ncols=2, nrows=2)

# 以下两行代码用法和下面的 GridSpec类似,注意对比
# gs_kw = dict(width_ratios=widths, height_ratios=heights)
# fig5, f5_axes = plt.subplots(ncols=3, nrows=3, gridspec_kw=gs_kw)

fig1.tight_layout()  # 自动紧凑布局
GridSpec
1、GridSpec与add_subplot()
# 示例1
# 该示例仅仅演示,一般不会这样子用,太冗长
fig2 = plt.figure()  # 此句代码不可或缺
spec2 = gridspec.GridSpec(ncols=2, nrows=2)

f2_ax1 = fig2.add_subplot(spec2[0, 0])
f2_ax2 = fig2.add_subplot(spec2[0, 1])
f2_ax3 = fig2.add_subplot(spec2[1, 0])
f2_ax4 = fig2.add_subplot(spec2[1, 1])

fig2.tight_layout()  # 自动紧凑布局


# 示例2
fig = plt.figure()
gs1 = gridspec.GridSpec(nrows=3, ncols=3, left=0.05, right=0.48, wspace=0.05)
ax1 = fig.add_subplot(gs1[:-1, :])
ax2 = fig.add_subplot(gs1[-1, :-1])
ax3 = fig.add_subplot(gs1[-1, -1])

# 示例3
#
fig4 = plt.figure()
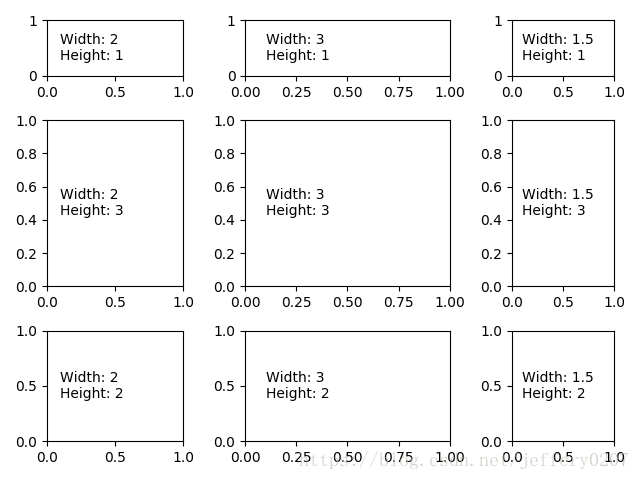
widths = [2, 3, 1.5]
heights = [1, 3, 2]
spec4 = gridspec.GridSpec(ncols=3, nrows=3, width_ratios=widths,
                          height_ratios=heights)
for row in range(3):
    for col in range(3):
        ax = fig4.add_subplot(spec4[row, col])
        label = 'Width: {}\nHeight: {}'.format(widths[col], heights[row])
        ax.annotate(label, (0.1, 0.5), xycoords='axes fraction', va='center')

fig4.tight_layout()  # 自动紧凑布局
示例2结果:
示例3结果:
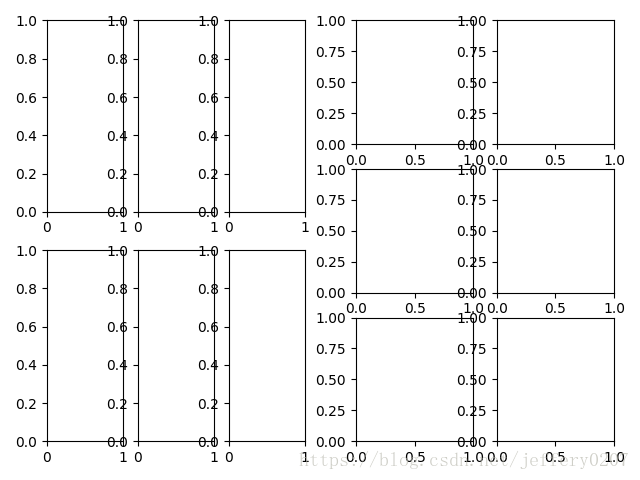
2、GridSpec与SubplotSpec
fig = plt.figure()
gs0 = gridspec.GridSpec(1, 2)

gs00 = gridspec.GridSpecFromSubplotSpec(2, 3, subplot_spec=gs0[0])
gs01 = gridspec.GridSpecFromSubplotSpec(3, 2, subplot_spec=gs0[1])

for a in range(2):
    for b in range(3):
        fig.add_subplot(gs00[a, b])
        fig.add_subplot(gs01[b, a])

fig.tight_layout()
# plt.tight_layout(pad=0.4, w_pad=0.5, h_pad=1.0)
subplot2grid
在常规网格内的特定位置创建轴
def example_plot(ax, fontsize=12):
    ax.plot([1, 2])

    ax.locator_params(nbins=3)
    ax.set_xlabel('x-label', fontsize=fontsize)
    ax.set_ylabel('y-label', fontsize=fontsize)
    ax.set_title('Title', fontsize=fontsize)


plt.close('all')
fig = plt.figure()

ax1 = plt.subplot2grid((3, 3), (0, 0))
ax2 = plt.subplot2grid((3, 3), (0, 1), colspan=2)
ax3 = plt.subplot2grid((3, 3), (1, 0), colspan=2, rowspan=2)
ax4 = plt.subplot2grid((3, 3), (1, 2), rowspan=2)

example_plot(ax1)
example_plot(ax2)
example_plot(ax3)
example_plot(ax4)

plt.tight_layout()
# tight_layout() only considers ticklabels, axis labels, and titles. Thus, other artists may be clipped and also may overlap
tight_Layout
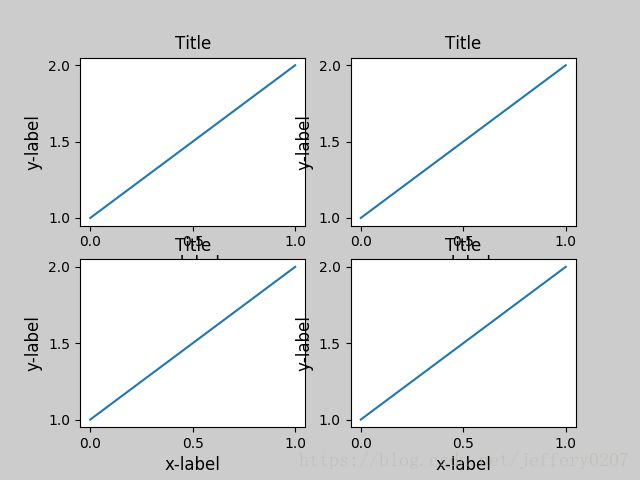
tight_layout在上面示例中已经出现过,在这里做一个补充说明,tight_layout自动调整subplot(s)参数,以便subplot(s)适应图形区域。这是一个实验性功能,在某些情况下可能无效,而且它仅对ticklabels, axis labels, titles有效。作图时我们可能会遇到这种问题,发现部分title、ticks、label被截断了,如下图所示:
这种情况下,参数我们就可以用tight_layout来进行微调,但是请注意,matplotlib.pyplot.tight_layout()仅在调用时调整subplot 。为了在每次重绘图形时执行此调整,您可以调用fig.set_tight_layout(True),或者等效地将figure.autolayout rcParam设置为True。 tight_layout还可以用来调整标题图形重叠的情况,如下图所示:
# 这样这个函数就类似于 adjust_subplots
plt.tight_layout(pad=0.4, w_pad=0.5, h_pad=1.0)


