60秒 Linux性能分析
简介
虽然很多人都有针对这个60秒性能分析的翻译,我依然要重写一遍,以加强记忆。
10个命令列表

上述的10个命令基本涵盖了cpu,内存,硬盘,网络以及内核错误等多个方面,能在短时间内快速评估系统以及进程的运行状态。这些命令需要安装sysstat包。
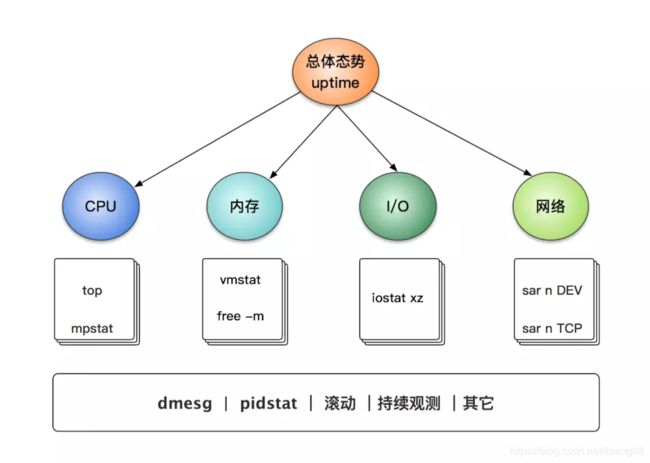
如果你记不住命令,那么请采用下图的宏观模式来辅助记忆,此图摘自另外一个强人RiboseYim:
1. uptime
uptime gives a one line display of the following information.  The current time, how long the system has been running, how many users are currently logged on, and the system load averages for the past 1, 5, and 15 minutes.

System load averages is the average number of processes that are either in a runnable or  uninterruptable  state.   A  process  in  a runnable state is either using the CPU or waiting to use the CPU.  A process in uninterruptable state is waiting for some I/O access, eg waiting for disk.  The averages are taken over the three time intervals.  Load averages are not normalized for the number of  CPUs in a system, so a load average of 1 means a single CPU system is loaded all the time while on a 4 CPU system it means it was idle 75% of the time
当前用户数目以及最近1分钟,5分钟以及15分钟的系统平均负载。系统平均负载指的是处于runnable(运行进程或者就绪进程)或者uninterruptable(不可中断的等待进程)状态的平均的进程数目。
$ uptime
23:51:26up21:31, 1user, loadaverage:30.02,26.43,19.02
上面的这个例子表明负载在不断上升,因为最近1分钟的平均负载(30.02)大于最近15分钟的平均负载(19.02)。
2. dmesg | tail
用于给出最近的10条系统消息,有些错误可能会报告出来,例如下面的日子报告了进程18694出现了OOM错误。
$ dmesg | tail
[1880957.563150] perl invoked oom-killer: gfp_mask=0x280da, order=0, oom_score_adj=0
[...]
[1880957.563400] Out of memory: Kill process 18694 (perl) score 246 or sacrifice child
[1880957.563408] Killed process 18694 (perl) total-vm:1972392kB, anon-rss:1953348kB, file-r
ss:0kB
[2320864.954447] TCP: Possible SYN flooding on port 7001. Dropping request. Check SNMP cou
nters.
3. top
这是查看一个能查看多种指标的工具,现在先简单将它归为查看cpu的工具。它的自动刷新机制可能使得历史数据被清除。
$ top
top - 14:37:59 up 3 days,  3:05,  4 users,  load average: 1.00, 1.00, 1.00
Tasks: 331 total,   2 running, 187 sleeping,   2 stopped,   0 zombie
%Cpu(s):  5.8 us,  0.3 sy,  0.0 ni, 93.7 id,  0.2 wa,  0.0 hi,  0.0 si,  0.0 st
KiB Mem : 82374984 total,   855152 free,  8901348 used, 72618480 buff/cache
KiB Swap:  4194300 total,  4194300 free,        0 used. 72147088 avail Mem

  PID USER      PR  NI    VIRT    RES    SHR S  %CPU %MEM     TIME+ COMMAND
24054 root      20   0 7013876 6.669g   6416 R  97.7  8.5   2437:36 cl_searching
12806 lpstudy 20   0  146360   4128   3284 R   0.7  0.0   0:00.15 top
    1 root      20   0  195216   9344   5036 S   0.0  0.0   0:55.69 systemd
    2 root      20   0       0      0      0 S   0.0  0.0   0:00.18 kthreadd
4. mpstat -P ALL 1
$ mpstat -P ALL 1
Linux 4.16.0+ (localhost)       2018年11月10日  _x86_64_        (16 CPU)

14时42分34秒  CPU    %usr   %nice    %sys %iowait    %irq   %soft  %steal  %guest  %gnice   %idle
14时42分35秒  all    6.00    0.00    0.19    0.00    0.00    0.00    0.00    0.00    0.00   93.81
14时42分35秒    0    0.00    0.00    0.00    0.00    0.00    0.00    0.00    0.00    0.00  100.00
14时42分35秒    1    0.00    0.00    0.00    0.00    0.00    0.00    0.00    0.00    0.00  100.00
14时42分35秒    2    0.00    0.00    0.00    0.00    0.00    0.00    0.00    0.00    0.00  100.00
14时42分35秒    3    0.00    0.00    0.00    0.00    0.00    0.00    0.00    0.00    0.00  100.00
14时42分35秒    4    0.00    0.00    0.00    0.00    0.00    0.00    0.00    0.00    0.00  100.00
...
刚才的top关系的是整体cpu的情况,而mpstat关注的是每个cpu processor(注意这个是逻辑核心)的情况,可帮助查看各个cpu逻辑核是否负载均衡。例如如果只有一个cpu繁忙,那可判断属于单进程的程序。
例如我们的机器有2个NUMA核心,一个上面有4个物理核心,每个物理核包括2个逻辑核心。因此,从mpstat来看一共是2 * 4 * 2 = 16个逻辑核心,cpu利用率最高为1600%。
5. free -m
看完cpu的情况之后,可关注内存的情况。
$ free -m
              total        used        free      shared  buff/cache   available
Mem:          80444        8719         911          17       70813       70428
Swap:          4095           0        4095
这里free代表当前的空闲内存,还不到1个G。如果free很小,可能会导致进程申请内存失败。
注意:对于本例子来说,系统依然有很多可用内存(虽然不是free)。如上例,buff/cache有70个G的样子,这些内存是临时的缓存(buff是块设备缓存,cache是文件系统page cache),可被回收。因此available列的数据有接近70个G。
6. vmstat 1
$ vmstat 1
procs -----------memory---------- ---swap-- -----io---- -system-- ------cpu-----
 r  b   swpd   free   buff  cache   si   so    bi    bo   in   cs us sy id wa st
 1  0      0 932068   2448 72472880    0    0    23    20    4    3 17  0 82  0  0
 1  0      0 931820   2448 72472944    0    0    64     0 1064  135  6  0 94  0  0
 1  0      0 931696   2448 72473024    0    0    84     0 1024   93  6  0 94  0  0
...
每个一秒输出一行,分别包括进程,内存,swap,I/O,系统以及cpu相关统计值。具体每列的值,可以参考man vmstat。
简单总结几个注意点:
r列:代表运行的进程数目(就绪或者运行),很大表明工作量很多;
memeory列可以根据free -m的结果进行分析;
si和so:如果它的值非0,表明内存不够用,交换分区起用了;
us,sy等:代表user,sys,idle,wait,以及stole time。 user time很大表明用户任务繁忙,wait很大表明磁盘I/O时间很长,这个时候cpu一般是空闲的(需要阻塞等待),它类似于idle,但是不同的是,cpu处于等待I/O而无法执行。
7. iostat -xm 1
写完内存之后,我们来看看磁盘I/O吧。如果你的磁盘超负载运行,那么程序会很慢很慢,一定要关注。
$ iostat -xm 1
Linux 4.16.0+ (localhost)       2018年11月10日  _x86_64_        (16 CPU)

avg-cpu:  %user   %nice %system %iowait  %steal   %idle
          17.10    0.00    0.31    0.17    0.00   82.42

Device:         rrqm/s   wrqm/s     r/s     w/s    rMB/s    wMB/s avgrq-sz avgqu-sz   await r_await w_await  svctm  %util
nvme0n1           0.00     0.00    0.00    0.00     0.00     0.00   139.84     0.00    0.32    0.03    0.55   0.03   0.00
sdb               0.00     0.00    0.00    0.00     0.00     0.00    52.41     0.00    0.27    0.28    0.00   0.13   0.00
sda               0.00     0.30    6.77    1.39     0.35     0.30   163.90     0.12   14.80    6.06   57.36   4.11   3.35
sdc               0.00     0.00    0.00    0.00     0.00     0.00    36.35     0.00    1.99    1.99    0.00   1.82   0.00
...
上面的数据太多列了,重点关注r/s, w/s, rMB/s, wMB/s, avgqu-sz, await, %util。
r/s, w/s: 每秒读写设备的次数(可认为是随机读的次数),一般情况下随机读几百次硬盘就扛不住了;
rMB/s, wMB/s: 每秒读写字节数;
avgqu-sz: 平均的I/O等待队列大小,如果大于0,表明有I/O在等待;
await:平均服务时间(包括等待以及服务的时间的总和);
%util:磁盘利用率,这个太有用了,如果利用率为100%,那么磁盘I/O基本上处于饱和状态。
8. sar -n DEV 1
看完了磁盘I/O,来瞧瞧网络如何?
$ sar -n DEV 1
Linux 4.16.0+ (localhost)       2018年11月10日  _x86_64_        (16 CPU)

00时00分01秒     IFACE   rxpck/s   txpck/s    rxkB/s    txkB/s   rxcmp/s   txcmp/s  rxmcst/s
00时10分01秒       em2      0.00      0.00      0.00      0.00      0.00      0.00      0.00
00时10分01秒       em1      0.10      0.07      0.01      0.01      0.00      0.00      0.00
00时10分01秒        lo      0.03      0.03      0.00      0.00      0.00      0.00      0.00
00时10分01秒    virbr0      0.00      0.00      0.00      0.00      0.00      0.00      0.00
00时10分01秒 virbr0-nic      0.00      0.00      0.00      0.00      0.00      0.00      0.00
...
查看网络接口吞吐量,如下:
rxpck/s, txpck/s: 网卡每条的读写(传入,传出)的packets数目;
rxkB/s, txkB/s: 网卡每秒读写的字节数据量(可判断网卡是否打满)。
9. sar -n TCP, ETCP 1
实际业务中,TCP请求居多,来重点关注一下TCP连接的请求相关情况。
$ sar -n TCP,ETCP 1
Linux 4.16.0+ (localhost)       2018年11月10日  _x86_64_        (16 CPU)

16时03分39秒  active/s passive/s    iseg/s    oseg/s
16时03分40秒      0.00      0.00      0.00      0.00

16时03分39秒  atmptf/s  estres/s retrans/s isegerr/s   orsts/s
16时03分40秒      0.00      0.00      0.00      0.00      0.00

16时03分40秒  active/s passive/s    iseg/s    oseg/s
...
TCP和ETCP(error TCP)选项主要是用来关注正常或者异常的TCP相关负载参数,重点关注几个:
active/s:主动发起的连接数目(每秒本地发起connect的数量);
passive/s:每秒接收的连接数量(listen之后的accept的数量);
iseg/s:输入的segment频率;
oseg/s:输出逇segment频率;
retrans/s:TCP重传的频率。
10. pidstat 1
上面如果你完全看完了,那么应该具有了基本感知,cpu,内存,磁盘和网络,以及dmesg。本例的pidstat可以看做是进程管理的一种情况,专门用来关注task的,可以看到pid的很多额外信息,例如内存,磁盘I/O等。
[lipeng@localhost exmaple_perf]$ pidstat 1
Linux 4.16.0+ (localhost)       2018年11月10日  _x86_64_        (16 CPU)

16时15分06秒   UID       PID    %usr %system  %guest    %CPU   CPU  Command
16时15分07秒     0       887    0.00    1.00    0.00    1.00    12  xfsaild/dm-1
16时15分07秒     0     10604    0.00    1.00    0.00    1.00    15  kworker/15:0
16时15分07秒  1002     18597    1.00    3.00    0.00    4.00    11  pidstat
16时15分07秒     0     24054   92.00    8.00    0.00  100.00     8  cl_searching
...
针对一个进程,一行记录,相比于top,它的优势在于是滚屏输出,而不是清屏。这样,有利于跟踪更长时间的窗口。
总结
仔细想了一下,还是比较好记住的。
重中之重要对其进行归类,总括(uptime),cpu(top, mpstat -P ALL 1),进程(pidstat 1),内存(vmstata 1, free -m),磁盘(iostat -xm 1)和网络(sar -n DEV 1, sar -n TCP,ETCP 1)。
参考资料:
- [1] http://techblog.neVlix.com/2015/11/linux-performance-analysis-in-60s.html
- [2] https://www.jianshu.com/p/11b01f3d9fb1
- [3] https://linuxtools-rst.readthedocs.io/zh_CN/latest/tool/iostat.html