<Python基础教程>里面的项目.用Python的包来进行数据可视化.下面的代码是PDF画图的原外型.
from reportlab.lib import colors
from reportlab.graphics.shapes import *
from reportlab.graphics import renderPDF

data = [
#    Year   Month   Predicted   High    Low
    (2007, 8, 113.2, 114.2, 112.2),
    (2007, 9, 112.8, 115.8, 109.8),
    (2007, 10, 111.0, 116.0, 106.0),
    (2007, 11, 109.8, 116.8, 102.8),
    (2007, 12, 107.3, 115.3, 99.3),
    (2008, 1, 105.2, 114.2, 96.2),
    (2008, 2, 104.1, 114.1, 94.1),
    (2008, 3, 99.9, 110.9, 88.9),
    (2008, 4, 94.8, 106.8, 82.8),
    (2008, 5, 91.2, 104.2, 78.2),
    ]

drawing = Drawing(200, 150)

pred = [row[2]-40 for row in data]
high = [row[3]-40 for row in data]
low = [row[4]-40 for row in data]
times = [200*((row[0] + row[1]/12.0) - 2007)-100 for row in data]

drawing.add(PolyLine(zip(times, pred), strokeColor = colors.blue))
drawing.add(PolyLine(zip(times, high), strokeColor = colors.red))
drawing.add(PolyLine(zip(times, low), strokeColor = colors.green))
drawing.add(String(65, 115, 'Sunspots', fonSize = 18, fillColor = colors.red))


renderPDF.drawToFile(drawing, 'report1.pdf', 'Sunspots')
下面的几段数据处理是为了使图像可以出现在绘图区域内Drawing(200, 150)
pred = [row[2]-40 for row in data]
high = [row[3]-40 for row in data]
low = [row[4]-40 for row in data]
times = [200*((row[0] + row[1]/12.0) - 2007)-100 for row in data]
下面就是程序运行的结果
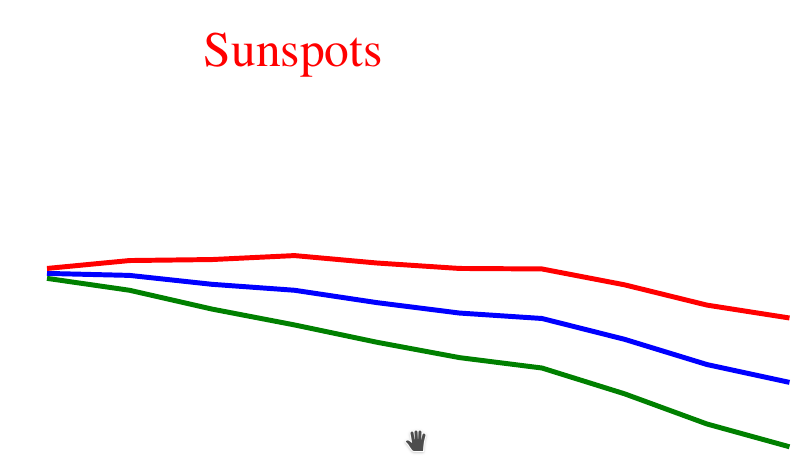
程序运行结果
最终的太阳黑子程序:
from urllib import urlopen
from reportlab.graphics.shapes import *
from reportlab.graphics.charts.lineplots import LinePlot
from reportlab.graphics.charts.textlabels import Label
from reportlab.graphics import renderPDF

URL = 'http://services.swpc.noaa.gov/text/predicted-sunspot-radio-flux.txt'
COMMENT_CHARS = '#:'

drawing = Drawing(400, 200)
data = []
for line in urlopen(URL).readlines():
        if not line.isspace() and not line[0] in COMMENT_CHARS:
                data.append([float(n) for n in line.split()])

pred = [row[2] for row in data]
high = [row[3] for row in data]
low = [row[4] for row in data]
times = [row[0] + row[1]/12.0 for row in data]
lp = LinePlot()
lp.x = 50
lp.y = 50
lp.height = 125
lp.width = 300
lp.data = [zip(times, pred),zip(times,high),zip(times, low)]
lp.lines[0].strokeColor = colors.blue
lp.lines[1].strokeColor = colors.red
lp.lines[2].strokeColor = colors.green

drawing.add(lp)
drawing.add(String(250,150, 'Sunspots',fontSize=14,fillColor=colors.red))

renderPDF.drawToFile(drawing, 'report2.pdf','Sunspots')
运行结果:

最终程序运行结果
上面的代码有两个函数(发方法)需要主要
1.Python isspace() 方法检测字符串是否只由空格组成。
2.Python split()通过指定分隔符对字符串进行切片,如果参数num 有指定值,则仅分隔 num 个子字符串