Prometheus监控平台是一套分布式监控系统,与传统的Zabbix、Nagios、Cacti 以及最近开源的Overwatch类似,都采用了“探针+服务中心”的架构模式,从目前的开源社区反馈来看,Prometheus是一套粘度较高、扩展性强、功能相对完备的分布式监控系统。
Prometheus监控系统跟Zabbix一样分为服务端和代理端,每一个被监控的对象都需要由代理探针采集信息并发送至服务端。PrometheusServer安装的就是prometheus软件,PrometheusAgent安装的是node_exporter软件。
以下是在CentOS71810平台上体验Prometheus监控系统的过程:
{Server上的操作}
[googlebigtable@localhost ~]$ su - root
Password:
[root@localhost ~]# mv /etc/yum.repos.d/CentOS-Base.repo /etc/yum.repos.d/CentOS-Base.repo.original
[root@localhost ~]# wget -O /etc/yum.repos.d/CentOS-Base.repo http://mirrors.163.com/.help/CentOS7-Base-163.repo
--2020-05-29 11:13:36-- http://mirrors.163.com/.help/CentOS7-Base-163.repo
Resolving mirrors.163.com (mirrors.163.com)... 59.111.0.251
Connecting to mirrors.163.com (mirrors.163.com)|59.111.0.251|:80... connected.
HTTP request sent, awaiting response... 200 OK
Length: 1572 (1.5K) [application/octet-stream]
Saving to: ‘/etc/yum.repos.d/CentOS-Base.repo’
100%[==================================================================================================>] 1,572 --.-K/s in 0s
2020-05-29 11:13:36 (5.78 MB/s) - ‘/etc/yum.repos.d/CentOS-Base.repo’ saved [1572/1572]
[root@localhost ~]# yum clean all
Loaded plugins: fastestmirror, langpacks
Existing lock /var/run/yum.pid: another copy is running as pid 21425.
Another app is currently holding the yum lock; waiting for it to exit...
The other application is: PackageKit
Memory : 163 M RSS (1.5 GB VSZ)
Started: Fri May 29 11:09:52 2020 - 04:03 ago
State : Sleeping, pid: 21425
Another app is currently holding the yum lock; waiting for it to exit...
The other application is: PackageKit
Memory : 163 M RSS (1.5 GB VSZ)
Started: Fri May 29 11:09:52 2020 - 04:05 ago
State : Sleeping, pid: 21425
Another app is currently holding the yum lock; waiting for it to exit...
The other application is: PackageKit
Memory : 163 M RSS (1.5 GB VSZ)
Started: Fri May 29 11:09:52 2020 - 04:07 ago
State : Sleeping, pid: 21425
^C
Exiting on user cancel.
[root@localhost ~]# kill -9 21425
[root@localhost ~]# ps -aux | grep yum
root 22395 0.0 0.0 112708 968 pts/0 S+ 11:14 0:00 grep --color=auto yum
[root@localhost ~]# yum clean all
BDB2053 Freeing read locks for locker 0xbc1: 21425/140301756725056
BDB2053 Freeing read locks for locker 0xbc3: 21425/140301756725056
Loaded plugins: fastestmirror, langpacks
Cleaning repos: base extras updates
Cleaning up list of fastest mirrors
[root@localhost ~]# yum makecache
Loaded plugins: fastestmirror, langpacks
Determining fastest mirrors
base | 3.6 kB 00:00:00
extras | 2.9 kB 00:00:00
updates | 2.9 kB 00:00:00
(1/10): base/7/x86_64/group_gz | 153 kB 00:00:00
(2/10): base/7/x86_64/primary_db | 6.1 MB 00:00:04
(3/10): base/7/x86_64/filelists_db | 7.1 MB 00:00:04
(4/10): extras/7/x86_64/filelists_db | 205 kB 00:00:00
(5/10): extras/7/x86_64/primary_db | 194 kB 00:00:00
(6/10): extras/7/x86_64/other_db | 122 kB 00:00:00
(7/10): updates/7/x86_64/filelists_db | 980 kB 00:00:00
(8/10): updates/7/x86_64/other_db | 183 kB 00:00:00
(9/10): updates/7/x86_64/primary_db | 1.3 MB 00:00:01
(10/10): base/7/x86_64/other_db | 2.6 MB 00:00:01
Metadata Cache Created
[root@localhost ~]# hostnamectl set-hostname prometheusserver
[root@localhost ~]# hostnamectl status
Static hostname: prometheusserver
Icon name: computer-vm
Chassis: vm
Machine ID: 50c301ed2ccb424ca12f203b8d512277
Boot ID: 7eb4844f986142e9b5bb008bcda072f1
Virtualization: vmware
Operating System: CentOS Linux 7 (Core)
CPE OS Name: cpe:/o:centos:centos:7
Kernel: Linux 3.10.0-957.el7.x86_64
Architecture: x86-64
[root@localhost ~]# yum -y update
Loaded plugins: fastestmirror, langpacks
Loading mirror speeds from cached hostfile
Resolving Dependencies
...............................................................................................................................
Complete!
You have new mail in /var/spool/mail/root
[root@localhost ~]#
【安装所需软件包prometheus-2.9.2.linux-amd64.tar.gz我已经从GitHub上下载到了本地,并上传到了腾讯微云存储,地址是https://www.weiyun.com/disk】
Prometheus组件的官方下载地址为:
https://github.com/prometheus/prometheus/releases/download/v2.9.2/prometheus-2.9.2.linux-amd64.tar.gz
https://github.com/prometheus/node_exporter/releases/download/v0.17.0/node_exporter-0.17.0.linux-amd64.tar.gz
[root@localhost ~]# cp /home/googlebigtable/Downloads/prometheus-2.9.2.linux-amd64.tar.gz .
[root@localhost ~]# ls -F
anaconda-ks.cfg initial-setup-ks.cfg prometheus-2.9.2.linux-amd64.tar.gz
[root@localhost ~]# ifconfig -a
ens33: flags=4163
inet 192.168.207.133 netmask 255.255.255.0 broadcast 192.168.207.255
inet6 fe80::e205:cdcb:81f2:c6c5 prefixlen 64 scopeid 0x20
ether 00:0c:29:53:fd:a3 txqueuelen 1000 (Ethernet)
RX packets 1047562 bytes 1506801880 (1.4 GiB)
RX errors 0 dropped 0 overruns 0 frame 0
TX packets 501593 bytes 30774380 (29.3 MiB)
TX errors 0 dropped 0 overruns 0 carrier 0 collisions 0
lo: flags=73
inet 127.0.0.1 netmask 255.0.0.0
inet6 ::1 prefixlen 128 scopeid 0x10
loop txqueuelen 1000 (Local Loopback)
RX packets 8 bytes 404 (404.0 B)
RX errors 0 dropped 0 overruns 0 frame 0
TX packets 8 bytes 404 (404.0 B)
TX errors 0 dropped 0 overruns 0 carrier 0 collisions 0
virbr0: flags=4099
inet 192.168.122.1 netmask 255.255.255.0 broadcast 192.168.122.255
ether 52:54:00:57:62:e3 txqueuelen 1000 (Ethernet)
RX packets 0 bytes 0 (0.0 B)
RX errors 0 dropped 0 overruns 0 frame 0
TX packets 0 bytes 0 (0.0 B)
TX errors 0 dropped 0 overruns 0 carrier 0 collisions 0
virbr0-nic: flags=4098
ether 52:54:00:57:62:e3 txqueuelen 1000 (Ethernet)
RX packets 0 bytes 0 (0.0 B)
RX errors 0 dropped 0 overruns 0 frame 0
TX packets 0 bytes 0 (0.0 B)
TX errors 0 dropped 0 overruns 0 carrier 0 collisions 0
[root@localhost ~]# cat -n /etc/hosts
1 127.0.0.1 localhost localhost.localdomain localhost4 localhost4.localdomain4
2 ::1 localhost localhost.localdomain localhost6 localhost6.localdomain6
[root@localhost ~]# echo "192.168.207.133 prometheusserver" >> /etc/hosts
[root@localhost ~]# cat -n /etc/hosts
1 127.0.0.1 localhost localhost.localdomain localhost4 localhost4.localdomain4
2 ::1 localhost localhost.localdomain localhost6 localhost6.localdomain6
3 192.168.207.133 prometheusserver
[root@localhost ~]# yum install -y ntpdate
Loaded plugins: fastestmirror, langpacks
Loading mirror speeds from cached hostfile
Package ntpdate-4.2.6p5-29.el7.centos.x86_64 already installed and latest version
Nothing to do
[root@localhost ~]# ntpdate cn.ntp.org.cn
29 May 11:47:03 ntpdate[119808]: adjust time server 114.118.7.161 offset -0.004131 sec
[root@localhost ~]# systemctl stop firewalld && systemctl disable firewalld
Removed symlink /etc/systemd/system/multi-user.target.wants/firewalld.service.
Removed symlink /etc/systemd/system/dbus-org.fedoraproject.FirewallD1.service.
[root@localhost ~]# sed -i 's/^SELINUX=./SELINUX=disabled/' /etc/selinux/config && setenforce 0
[root@localhost ~]# sestatus
SELinux status: enabled
SELinuxfs mount: /sys/fs/selinux
SELinux root directory: /etc/selinux
Loaded policy name: targeted
Current mode: permissive
Mode from config file: disabled
Policy MLS status: enabled
Policy deny_unknown status: allowed
Max kernel policy version: 31
[root@localhost ~]# init 6
[root@prometheusserver ~]# sestatus
SELinux status: disabled
[root@prometheusserver ~]# ls -F
anaconda-ks.cfg initial-setup-ks.cfg prometheus-2.9.2.linux-amd64.tar.gz
[root@prometheusserver ~]# tar -xzvf prometheus-2.9.2.linux-amd64.tar.gz -C /usr/local/
prometheus-2.9.2.linux-amd64/
prometheus-2.9.2.linux-amd64/consoles/
prometheus-2.9.2.linux-amd64/consoles/node-cpu.html
prometheus-2.9.2.linux-amd64/consoles/prometheus.html
prometheus-2.9.2.linux-amd64/consoles/node.html
prometheus-2.9.2.linux-amd64/consoles/prometheus-overview.html
prometheus-2.9.2.linux-amd64/consoles/node-overview.html
prometheus-2.9.2.linux-amd64/consoles/index.html.example
prometheus-2.9.2.linux-amd64/consoles/node-disk.html
prometheus-2.9.2.linux-amd64/console_libraries/
prometheus-2.9.2.linux-amd64/console_libraries/menu.lib
prometheus-2.9.2.linux-amd64/console_libraries/prom.lib
prometheus-2.9.2.linux-amd64/promtool
prometheus-2.9.2.linux-amd64/prometheus.yml
prometheus-2.9.2.linux-amd64/LICENSE
prometheus-2.9.2.linux-amd64/NOTICE
prometheus-2.9.2.linux-amd64/prometheus
[root@prometheusserver ~]# cd /usr/local/
[root@prometheusserver local]# ls -F
bin/ etc/ games/ include/ lib/ lib64/ libexec/ prometheus-2.9.2.linux-amd64/ sbin/ share/ src/
[root@prometheusserver local]# ln -sv /usr/local/prometheus-2.9.2.linux-amd64/ /usr/local/Prometheus
‘/usr/local/Prometheus’ -> ‘/usr/local/prometheus-2.9.2.linux-amd64/’
[root@prometheusserver local]# ls -F
bin/ etc/ games/ include/ lib/ lib64/ libexec/ Prometheus@ prometheus-2.9.2.linux-amd64/ sbin/ share/ src/
[root@prometheusserver local]# cd prometheus-2.9.2.linux-amd64/
[root@prometheusserver prometheus-2.9.2.linux-amd64]# ls -F
console_libraries/ consoles/ LICENSE NOTICE prometheus prometheus.yml promtool*
[root@prometheusserver prometheus-2.9.2.linux-amd64]#
[root@prometheusserver prometheus-2.9.2.linux-amd64]# cat -n prometheus.yml
1 # my global config
2 global:
3 scrape_interval: 15s # Set the scrape interval to every 15 seconds. Default is every 1 minute.
4 evaluation_interval: 15s # Evaluate rules every 15 seconds. The default is every 1 minute.
5 # scrape_timeout is set to the global default (10s).
6
7 # Alertmanager configuration
8 alerting:
9 alertmanagers:
10 - static_configs:
11 - targets:
12 # - alertmanager:9093
13
14 # Load rules once and periodically evaluate them according to the global 'evaluation_interval'.
15 rule_files:
16 # - "first_rules.yml"
17 # - "second_rules.yml"
18
19 # A scrape configuration containing exactly one endpoint to scrape:
20 # Here it's Prometheus itself.
21 scrape_configs:
22 # The job name is added as a label job=<job_name> to any timeseries scraped from this config.
23 - job_name: 'prometheus'
24
25 # metrics_path defaults to '/metrics'
26 # scheme defaults to 'http'.
27
28 static_configs:
29 - targets: ['localhost:9090']
[root@prometheusserver prometheus-2.9.2.linux-amd64]#
[root@prometheusserver prometheus-2.9.2.linux-amd64]# ./prometheus --config.file="/usr/local/prometheus-2.9.2.linux-amd64/prometheus.yml" &
[1] 11086
[root@prometheusserver prometheus-2.9.2.linux-amd64]# level=info ts=2020-05-29T15:58:39.551Z caller=main.go:285 msg="no time or size retention was set so using the default time retention" duration=15d
level=info ts=2020-05-29T15:58:39.551Z caller=main.go:321 msg="Starting Prometheus" version="(version=2.9.2, branch=HEAD, revision=d3245f15022551c6fc8281766ea62db4d71e2747)"
level=info ts=2020-05-29T15:58:39.551Z caller=main.go:322 build_context="(go=go1.12.4, user=root@1d43b6951e8f, date=20190424-15:32:31)"
level=info ts=2020-05-29T15:58:39.551Z caller=main.go:323 host_details="(Linux 3.10.0-1127.8.2.el7.x86_64 #1 SMP Tue May 12 16:57:42 UTC 2020 x86_64 prometheusserver (none))"
level=info ts=2020-05-29T15:58:39.551Z caller=main.go:324 fd_limits="(soft=1024, hard=4096)"
level=info ts=2020-05-29T15:58:39.551Z caller=main.go:325 vm_limits="(soft=unlimited, hard=unlimited)"
level=info ts=2020-05-29T15:58:39.552Z caller=main.go:640 msg="Starting TSDB ..."
level=info ts=2020-05-29T15:58:39.552Z caller=web.go:416 component=web msg="Start listening for connections" address=0.0.0.0:9090
level=info ts=2020-05-29T15:58:39.556Z caller=main.go:655 msg="TSDB started"
level=info ts=2020-05-29T15:58:39.556Z caller=main.go:724 msg="Loading configuration file" filename=/usr/local/prometheus-2.9.2.linux-amd64/prometheus.yml
level=info ts=2020-05-29T15:58:39.557Z caller=main.go:751 msg="Completed loading of configuration file" filename=/usr/local/prometheus-2.9.2.linux-amd64/prometheus.yml
level=info ts=2020-05-29T15:58:39.557Z caller=main.go:609 msg="Server is ready to receive web requests."
^C
[root@prometheusserver prometheus-2.9.2.linux-amd64]# lsof -i:9090
COMMAND PID USER FD TYPE DEVICE SIZE/OFF NODE NAME
prometheu 11086 root 3u IPv6 48602 0t0 TCP :websm (LISTEN)
prometheu 11086 root 7u IPv4 48604 0t0 TCP localhost:42352->localhost:websm (ESTABLISHED)
prometheu 11086 root 8u IPv6 49854 0t0 TCP localhost:websm->localhost:42352 (ESTABLISHED)
prometheu 11086 root 9u IPv6 48607 0t0 TCP localhost:59422->localhost:websm (ESTABLISHED)
prometheu 11086 root 10u IPv6 49856 0t0 TCP localhost:websm->localhost:59422 (ESTABLISHED)
prometheu 11086 root 11u IPv6 53614 0t0 TCP prometheusserver:websm->prometheusserver:51226 (ESTABLISHED)
prometheu 11086 root 13u IPv6 56622 0t0 TCP prometheusserver:websm->prometheusserver:51230 (ESTABLISHED)
prometheu 11086 root 14u IPv6 56623 0t0 TCP prometheusserver:websm->prometheusserver:51232 (ESTABLISHED)
prometheu 11086 root 15u IPv6 56624 0t0 TCP prometheusserver:websm->prometheusserver:51234 (ESTABLISHED)
prometheu 11086 root 16u IPv6 56625 0t0 TCP prometheusserver:websm->prometheusserver:51236 (ESTABLISHED)
firefox 11108 googlebigtable 188u IPv4 56617 0t0 TCP prometheusserver:51230->prometheusserver:websm (ESTABLISHED)
firefox 11108 googlebigtable 200u IPv4 56618 0t0 TCP prometheusserver:51232->prometheusserver:websm (ESTABLISHED)
firefox 11108 googlebigtable 206u IPv4 56619 0t0 TCP prometheusserver:51234->prometheusserver:websm (ESTABLISHED)
firefox 11108 googlebigtable 210u IPv4 56605 0t0 TCP prometheusserver:51226->prometheusserver:websm (ESTABLISHED)
firefox 11108 googlebigtable 212u IPv4 56620 0t0 TCP prometheusserver:51236->prometheusserver:websm (ESTABLISHED)
[root@prometheusserver prometheus-2.9.2.linux-amd64]# ss -naltp |grep 9090
LISTEN 0 128 [::]:9090 [::]: users:(("prometheus",pid=11086,fd=3))
[root@prometheusserver prometheus-2.9.2.linux-amd64]#
[root@prometheusserver prometheus-2.9.2.linux-amd64]# pkill prometheus
level=warn ts=2020-05-29T16:21:57.976Z caller=main.go:484 msg="Received SIGTERM, exiting gracefully..."
level=info ts=2020-05-29T16:21:57.976Z caller=main.go:509 msg="Stopping scrape discovery manager..."
level=info ts=2020-05-29T16:21:57.976Z caller=main.go:523 msg="Stopping notify discovery manager..."
level=info ts=2020-05-29T16:21:57.976Z caller=main.go:545 msg="Stopping scrape manager..."
level=info ts=2020-05-29T16:21:57.976Z caller=main.go:505 msg="Scrape discovery manager stopped"
level=info ts=2020-05-29T16:21:57.976Z caller=main.go:519 msg="Notify discovery manager stopped"
level=info ts=2020-05-29T16:21:57.976Z caller=manager.go:743 component="rule manager" msg="Stopping rule manager..."
level=info ts=2020-05-29T16:21:57.976Z caller=manager.go:749 component="rule manager" msg="Rule manager stopped"
[root@prometheusserver prometheus-2.9.2.linux-amd64]# level=info ts=2020-05-29T16:21:57.976Z caller=main.go:539 msg="Scrape manager stopped"
level=info ts=2020-05-29T16:21:57.977Z caller=notifier.go:527 component=notifier msg="Stopping notification manager..."
level=info ts=2020-05-29T16:21:57.977Z caller=main.go:708 msg="Notifier manager stopped"
level=info ts=2020-05-29T16:21:57.977Z caller=main.go:720 msg="See you next time!"
^C
[1]+ Done ./prometheus --config.file="/usr/local/prometheus-2.9.2.linux-amd64/prometheus.yml"
[root@prometheusserver prometheus-2.9.2.linux-amd64]# lsof -i:9090
[root@prometheusserver prometheus-2.9.2.linux-amd64]# ss -naltp |grep 9090
[root@prometheusserver prometheus-2.9.2.linux-amd64]# ls -F
console_libraries/ consoles/ data/ LICENSE NOTICE prometheus prometheus.yml promtool
[root@prometheusserver prometheus-2.9.2.linux-amd64]# gedit prometheus.yml
[root@prometheusserver prometheus-2.9.2.linux-amd64]# cat -n prometheus.yml
1 # my global config
2 global:
3 scrape_interval: 15s # Set the scrape interval to every 15 seconds. Default is every 1 minute.
4 evaluation_interval: 15s # Evaluate rules every 15 seconds. The default is every 1 minute.
5 # scrape_timeout is set to the global default (10s).
6
7 # Alertmanager configuration
8 alerting:
9 alertmanagers:
10 - static_configs:
11 - targets:
12 # - alertmanager:9093
13
14 # Load rules once and periodically evaluate them according to the global 'evaluation_interval'.
15 rule_files:
16 # - "first_rules.yml"
17 # - "second_rules.yml"
18
19 # A scrape configuration containing exactly one endpoint to scrape:
20 # Here it's Prometheus itself.
21 scrape_configs:
22 # The job name is added as a label job=<job_name> to any timeseries scraped from this config.
23 - job_name: 'prometheus'
24
25 # metrics_path defaults to '/metrics'
26 # scheme defaults to 'http'.
27
28 static_configs:
29 - targets: ['localhost:9090']
30
31 - job_name: 'DBsingle192.168.207.133'
32 static_configs:
33 - targets: ['192.168.207.133:3306']
[root@prometheusserver prometheus-2.9.2.linux-amd64]# ./prometheus --config.file="/usr/local/prometheus-2.9.2.linux-amd64/prometheus.yml" &
[1] 65072
[root@prometheusserver prometheus-2.9.2.linux-amd64]# level=info ts=2020-05-29T16:23:26.786Z caller=main.go:285 msg="no time or size retention was set so using the default time retention" duration=15d
level=info ts=2020-05-29T16:23:26.786Z caller=main.go:321 msg="Starting Prometheus" version="(version=2.9.2, branch=HEAD, revision=d3245f15022551c6fc8281766ea62db4d71e2747)"
level=info ts=2020-05-29T16:23:26.786Z caller=main.go:322 build_context="(go=go1.12.4, user=root@1d43b6951e8f, date=20190424-15:32:31)"
level=info ts=2020-05-29T16:23:26.786Z caller=main.go:323 host_details="(Linux 3.10.0-1127.8.2.el7.x86_64 #1 SMP Tue May 12 16:57:42 UTC 2020 x86_64 prometheusserver (none))"
level=info ts=2020-05-29T16:23:26.786Z caller=main.go:324 fd_limits="(soft=1024, hard=4096)"
level=info ts=2020-05-29T16:23:26.786Z caller=main.go:325 vm_limits="(soft=unlimited, hard=unlimited)"
level=info ts=2020-05-29T16:23:26.788Z caller=main.go:640 msg="Starting TSDB ..."
level=info ts=2020-05-29T16:23:26.788Z caller=web.go:416 component=web msg="Start listening for connections" address=0.0.0.0:9090
level=info ts=2020-05-29T16:23:26.801Z caller=main.go:655 msg="TSDB started"
level=info ts=2020-05-29T16:23:26.801Z caller=main.go:724 msg="Loading configuration file" filename=/usr/local/prometheus-2.9.2.linux-amd64/prometheus.yml
level=info ts=2020-05-29T16:23:26.803Z caller=main.go:751 msg="Completed loading of configuration file" filename=/usr/local/prometheus-2.9.2.linux-amd64/prometheus.yml
level=info ts=2020-05-29T16:23:26.803Z caller=main.go:609 msg="Server is ready to receive web requests."
^C
[root@prometheusserver prometheus-2.9.2.linux-amd64]# lsof -i:9090
COMMAND PID USER FD TYPE DEVICE SIZE/OFF NODE NAME
firefox 11108 googlebigtable 138u IPv4 123915 0t0 TCP prometheusserver:51780->prometheusserver:websm (ESTABLISHED)
firefox 11108 googlebigtable 140u IPv4 123916 0t0 TCP prometheusserver:51782->prometheusserver:websm (ESTABLISHED)
firefox 11108 googlebigtable 150u IPv4 123933 0t0 TCP prometheusserver:51788->prometheusserver:websm (ESTABLISHED)
firefox 11108 googlebigtable 156u IPv4 123934 0t0 TCP prometheusserver:51790->prometheusserver:websm (ESTABLISHED)
firefox 11108 googlebigtable 162u IPv4 123024 0t0 TCP prometheusserver:51784->prometheusserver:websm (ESTABLISHED)
firefox 11108 googlebigtable 167u IPv4 123025 0t0 TCP prometheusserver:51786->prometheusserver:websm (ESTABLISHED)
prometheu 65072 root 6u IPv6 120458 0t0 TCP :websm (LISTEN)
prometheu 65072 root 7u IPv4 122920 0t0 TCP localhost:43114->localhost:websm (ESTABLISHED)
prometheu 65072 root 8u IPv6 120459 0t0 TCP localhost:websm->localhost:43114 (ESTABLISHED)
prometheu 65072 root 9u IPv6 122828 0t0 TCP localhost:60186->localhost:websm (ESTABLISHED)
prometheu 65072 root 10u IPv6 122921 0t0 TCP localhost:websm->localhost:60186 (ESTABLISHED)
prometheu 65072 root 11u IPv6 120553 0t0 TCP prometheusserver:websm->prometheusserver:51788 (ESTABLISHED)
prometheu 65072 root 12u IPv6 121636 0t0 TCP prometheusserver:websm->prometheusserver:51780 (ESTABLISHED)
prometheu 65072 root 13u IPv6 121637 0t0 TCP prometheusserver:websm->prometheusserver:51782 (ESTABLISHED)
prometheu 65072 root 14u IPv6 120526 0t0 TCP prometheusserver:websm->prometheusserver:51784 (ESTABLISHED)
prometheu 65072 root 15u IPv6 120527 0t0 TCP prometheusserver:websm->prometheusserver:51786 (ESTABLISHED)
prometheu 65072 root 16u IPv6 120554 0t0 TCP prometheusserver:websm->prometheusserver:51790 (ESTABLISHED)
[root@prometheusserver prometheus-2.9.2.linux-amd64]# ss -naltp |grep 9090
LISTEN 0 128 [::]:9090 [::]: users:(("prometheus",pid=65072,fd=6))
[root@prometheusserver prometheus-2.9.2.linux-amd64]#
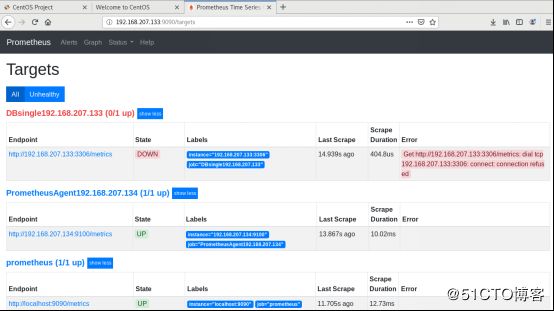
【出现红色的DOWN说明PrometheusServer中配置了对DBsingle192.168.207.133的监测,但未从相应的Agent上采集到的监控信息。这里192.168.207.133这台主机上既运行了PrometheusServer服务,也运行了数据库服务,数据库的监听端口是3306,因此在PrometheusServer的配置文件的配置信息是:
要获取数据库服务的监测信息,需要在数据库服务所在的主机上部署Agent组件node_exporter】
我自己已经将Agent组件node_exporter从GitHub下载到了本地,并上传到了腾讯微云存储,地址是https://www.weiyun.com/disk
[root@prometheusserver prometheus-2.9.2.linux-amd64]# cd ~
[root@prometheusserver ~]# ls -F
anaconda-ks.cfg initial-setup-ks.cfg prometheus-2.9.2.linux-amd64.tar.gz
[root@prometheusserver ~]# cp /home/googlebigtable/Downloads/node_exporter-0.17.0.linux-amd64.tar.gz .
[root@prometheusserver ~]# ls -F
anaconda-ks.cfg initial-setup-ks.cfg node_exporter-0.17.0.linux-amd64.tar.gz prometheus-2.9.2.linux-amd64.tar.gz
[root@prometheusserver ~]# tar -xzvf node_exporter-0.17.0.linux-amd64.tar.gz -C /usr/local/
node_exporter-0.17.0.linux-amd64/
node_exporter-0.17.0.linux-amd64/NOTICE
node_exporter-0.17.0.linux-amd64/node_exporter
node_exporter-0.17.0.linux-amd64/LICENSE
[root@prometheusserver ~]# cd /usr/local/
[root@prometheusserver local]# ls -F
bin/ games/ lib/ libexec/ Prometheus@ sbin/ src/
etc/ include/ lib64/ node_exporter-0.17.0.linux-amd64/ prometheus-2.9.2.linux-amd64/ share/
[root@prometheusserver local]# ln -sv /usr/local/node_exporter-0.17.0.linux-amd64/ /usr/local/Node_exporter
‘/usr/local/Node_exporter’ -> ‘/usr/local/node_exporter-0.17.0.linux-amd64/’
[root@prometheusserver local]# ls -F
bin/ games/ lib/ libexec/ node_exporter-0.17.0.linux-amd64/ prometheus-2.9.2.linux-amd64/ share/
etc/ include/ lib64/ Node_exporter@ Prometheus@ sbin/ src/
[root@prometheusserver local]# cd node_exporter-0.17.0.linux-amd64/
[root@prometheusserver node_exporter-0.17.0.linux-amd64]# ls -F
LICENSE node_exporter* NOTICE
[root@prometheusserver node_exporter-0.17.0.linux-amd64]# nohup /usr/local/node_exporter-0.17.0.linux-amd64/node_exporter &
[2] 65508
[root@prometheusserver node_exporter-0.17.0.linux-amd64]# nohup: ignoring input and appending output to ‘nohup.out’
[root@prometheusserver node_exporter-0.17.0.linux-amd64]# lsof -i:9100
COMMAND PID USER FD TYPE DEVICE SIZE/OFF NODE NAME
node_expo 65508 root 3u IPv6 129215 0t0 TCP :jetdirect (LISTEN)
[root@prometheusserver node_exporter-0.17.0.linux-amd64]# ss -naltp |grep 9100
LISTEN 0 128 [::]:9100 [::]: users:(("node_exporter",pid=65508,fd=3))
[root@prometheusserver node_exporter-0.17.0.linux-amd64]#
pkill prometheus
level=warn ts=2020-05-29T16:47:48.762Z caller=main.go:484 msg="Received SIGTERM, exiting gracefully..."
level=info ts=2020-05-29T16:47:48.762Z caller=main.go:509 msg="Stopping scrape discovery manager..."
level=info ts=2020-05-29T16:47:48.763Z caller=main.go:523 msg="Stopping notify discovery manager..."
level=info ts=2020-05-29T16:47:48.763Z caller=main.go:545 msg="Stopping scrape manager..."
level=info ts=2020-05-29T16:47:48.763Z caller=main.go:505 msg="Scrape discovery manager stopped"
level=info ts=2020-05-29T16:47:48.763Z caller=main.go:519 msg="Notify discovery manager stopped"
level=info ts=2020-05-29T16:47:48.763Z caller=manager.go:743 component="rule manager" msg="Stopping rule manager..."
level=info ts=2020-05-29T16:47:48.763Z caller=main.go:539 msg="Scrape manager stopped"
level=info ts=2020-05-29T16:47:48.763Z caller=manager.go:749 component="rule manager" msg="Rule manager stopped"
[root@prometheusserver node_exporter-0.17.0.linux-amd64]# level=info ts=2020-05-29T16:47:48.763Z caller=notifier.go:527 component=notifier msg="Stopping notification manager..."
level=info ts=2020-05-29T16:47:48.763Z caller=main.go:708 msg="Notifier manager stopped"
level=info ts=2020-05-29T16:47:48.764Z caller=main.go:720 msg="See you next time!"
^C
[1]- Done ./prometheus --config.file="/usr/local/prometheus-2.9.2.linux-amd64/prometheus.yml" (wd: /usr/local/prometheus-2.9.2.linux-amd64)
(wd now: /usr/local/node_exporter-0.17.0.linux-amd64)
[root@prometheusserver node_exporter-0.17.0.linux-amd64]#
[root@prometheusserver node_exporter-0.17.0.linux-amd64]# cd ..
[root@prometheusserver local]# ./prometheus-2.9.2.linux-amd64/prometheus --config.file="/usr/local/prometheus-2.9.2.linux-amd64/prometheus.yml" &
[3] 65650
[root@prometheusserver local]# level=info ts=2020-05-29T16:49:01.501Z caller=main.go:285 msg="no time or size retention was set so using the default time retention" duration=15d
level=info ts=2020-05-29T16:49:01.501Z caller=main.go:321 msg="Starting Prometheus" version="(version=2.9.2, branch=HEAD, revision=d3245f15022551c6fc8281766ea62db4d71e2747)"
level=info ts=2020-05-29T16:49:01.501Z caller=main.go:322 build_context="(go=go1.12.4, user=root@1d43b6951e8f, date=20190424-15:32:31)"
level=info ts=2020-05-29T16:49:01.501Z caller=main.go:323 host_details="(Linux 3.10.0-1127.8.2.el7.x86_64 #1 SMP Tue May 12 16:57:42 UTC 2020 x86_64 prometheusserver (none))"
level=info ts=2020-05-29T16:49:01.501Z caller=main.go:324 fd_limits="(soft=1024, hard=4096)"
level=info ts=2020-05-29T16:49:01.501Z caller=main.go:325 vm_limits="(soft=unlimited, hard=unlimited)"
level=info ts=2020-05-29T16:49:01.502Z caller=main.go:640 msg="Starting TSDB ..."
level=info ts=2020-05-29T16:49:01.502Z caller=web.go:416 component=web msg="Start listening for connections" address=0.0.0.0:9090
level=info ts=2020-05-29T16:49:01.515Z caller=main.go:655 msg="TSDB started"
level=info ts=2020-05-29T16:49:01.515Z caller=main.go:724 msg="Loading configuration file" filename=/usr/local/prometheus-2.9.2.linux-amd64/prometheus.yml
level=info ts=2020-05-29T16:49:01.516Z caller=main.go:751 msg="Completed loading of configuration file" filename=/usr/local/prometheus-2.9.2.linux-amd64/prometheus.yml
level=info ts=2020-05-29T16:49:01.516Z caller=main.go:609 msg="Server is ready to receive web requests."
^C
[root@prometheusserver local]# lsof -i:9090
COMMAND PID USER FD TYPE DEVICE SIZE/OFF NODE NAME
prometheu 65650 root 5u IPv6 129511 0t0 TCP :websm (LISTEN)
prometheu 65650 root 7u IPv4 130534 0t0 TCP localhost:43350->localhost:websm (ESTABLISHED)
prometheu 65650 root 8u IPv6 130535 0t0 TCP localhost:websm->localhost:43350 (ESTABLISHED)
prometheu 65650 root 9u IPv6 126902 0t0 TCP localhost:60420->localhost:websm (ESTABLISHED)
prometheu 65650 root 10u IPv6 129513 0t0 TCP localhost:websm->localhost:60420 (ESTABLISHED)
[root@prometheusserver local]# ss -naltp |grep 9090
LISTEN 0 128 [::]:9090 [::]: users:(("prometheus",pid=65650,fd=5))
[root@prometheusserver local]#
此时DBsingle192.168.207.133仍然处于DOWN状态且Get http://192.168.207.133:3306/metrics: dial tcp 192.168.207.133:3306: connect: connection refused,是因为当前Agent上的3306端口处于非监听状态,即3306端口的服务处于非运行状态。在本次实验中,是因为MySQL数据库服务没有运行。
[root@prometheusserver local]# lsof -i:3306
[root@prometheusserver local]# ss -naltp |grep 3306
[root@prometheusserver local]#
现在已经在Agent节点192.168.207.134上部署好node_exporter了,且可以通过 http://192.168.207.134:9100/metrics 查看到采集的监测信息:
现在打开PrometheusServer的配置文件添加Agent节点192.168.207.134上的被监控项目信息:
[root@prometheusserver local]# echo "192.168.207.134 prometheusagent" >> /etc/hosts
[root@prometheusserver local]# cat -n /etc/hosts
1 127.0.0.1 localhost localhost.localdomain localhost4 localhost4.localdomain4
2 ::1 localhost localhost.localdomain localhost6 localhost6.localdomain6
3 192.168.207.133 prometheusserver
4 192.168.207.134 prometheusagent
[root@prometheusserver local]# pwd -P
/usr/local
[root@prometheusserver local]# ls -F
bin/ etc/ include/ lib64/ Node_exporter@ Prometheus@ sbin/ src/
data/ games/ lib/ libexec/ node_exporter-0.17.0.linux-amd64/ prometheus-2.9.2.linux-amd64/ share/
[root@prometheusserver local]# gedit prometheus-2.9.2.linux-amd64/prometheus.yml
(gedit:66116): WARNING : 13:14:34.678: Set document metadata failed: Setting attribute metadata::gedit-spell-language not supported
(gedit:66116): WARNING : 13:14:34.678: Set document metadata failed: Setting attribute metadata::gedit-encoding not supported
(gedit:66116): WARNING : 13:14:36.267: Set document metadata failed: Setting attribute metadata::gedit-position not supported
[root@prometheusserver local]# cat -n ./prometheus-2.9.2.linux-amd64/prometheus.yml
1 # my global config
2 global:
3 scrape_interval: 15s # Set the scrape interval to every 15 seconds. Default is every 1 minute.
4 evaluation_interval: 15s # Evaluate rules every 15 seconds. The default is every 1 minute.
5 # scrape_timeout is set to the global default (10s).
6
7 # Alertmanager configuration
8 alerting:
9 alertmanagers:
10 - static_configs:
11 - targets:
12 # - alertmanager:9093
13
14 # Load rules once and periodically evaluate them according to the global 'evaluation_interval'.
15 rule_files:
16 # - "first_rules.yml"
17 # - "second_rules.yml"
18
19 # A scrape configuration containing exactly one endpoint to scrape:
20 # Here it's Prometheus itself.
21 scrape_configs:
22 # The job name is added as a label job=<job_name> to any timeseries scraped from this config.
23 - job_name: 'prometheus'
24
25 # metrics_path defaults to '/metrics'
26 # scheme defaults to 'http'.
27
28 static_configs:
29 - targets: ['localhost:9090']
30
31 - job_name: 'DBsingle192.168.207.133'
32 static_configs:
33 - targets: ['192.168.207.133:3306']
34
35 - job_name: 'PrometheusAgent192.168.207.134'
36 static_configs:
37 - targets: ['192.168.207.134:9100']
[root@prometheusserver local]# pkill prometheus
[root@prometheusserver local]# lsof -i:9090
[root@prometheusserver local]# ss -naltp |grep 9090
[root@prometheusserver local]# ./prometheus-2.9.2.linux-amd64/prometheus --config.file="/usr/local/prometheus-2.9.2.linux-amd64/prometheus.yml" &
[3] 66341
[root@prometheusserver local]# level=info ts=2020-05-29T17:24:20.746Z caller=main.go:285 msg="no time or size retention was set so using the default time retention" duration=15d
level=info ts=2020-05-29T17:24:20.747Z caller=main.go:321 msg="Starting Prometheus" version="(version=2.9.2, branch=HEAD, revision=d3245f15022551c6fc8281766ea62db4d71e2747)"
level=info ts=2020-05-29T17:24:20.747Z caller=main.go:322 build_context="(go=go1.12.4, user=root@1d43b6951e8f, date=20190424-15:32:31)"
level=info ts=2020-05-29T17:24:20.747Z caller=main.go:323 host_details="(Linux 3.10.0-1127.8.2.el7.x86_64 #1 SMP Tue May 12 16:57:42 UTC 2020 x86_64 prometheusserver (none))"
level=info ts=2020-05-29T17:24:20.747Z caller=main.go:324 fd_limits="(soft=1024, hard=4096)"
level=info ts=2020-05-29T17:24:20.747Z caller=main.go:325 vm_limits="(soft=unlimited, hard=unlimited)"
level=info ts=2020-05-29T17:24:20.748Z caller=main.go:640 msg="Starting TSDB ..."
level=info ts=2020-05-29T17:24:20.748Z caller=web.go:416 component=web msg="Start listening for connections" address=0.0.0.0:9090
level=info ts=2020-05-29T17:24:20.760Z caller=main.go:655 msg="TSDB started"
level=info ts=2020-05-29T17:24:20.760Z caller=main.go:724 msg="Loading configuration file" filename=/usr/local/prometheus-2.9.2.linux-amd64/prometheus.yml
level=info ts=2020-05-29T17:24:20.761Z caller=main.go:751 msg="Completed loading of configuration file" filename=/usr/local/prometheus-2.9.2.linux-amd64/prometheus.yml
level=info ts=2020-05-29T17:24:20.761Z caller=main.go:609 msg="Server is ready to receive web requests."
^C
[root@prometheusserver local]# lsof -i:9090
COMMAND PID USER FD TYPE DEVICE SIZE/OFF NODE NAME
firefox 11108 googlebigtable 98u IPv4 137654 0t0 TCP prometheusserver:52254->prometheusserver:websm (ESTABLISHED)
firefox 11108 googlebigtable 156u IPv4 139350 0t0 TCP prometheusserver:52258->prometheusserver:websm (ESTABLISHED)
firefox 11108 googlebigtable 158u IPv4 139351 0t0 TCP prometheusserver:52260->prometheusserver:websm (ESTABLISHED)
firefox 11108 googlebigtable 162u IPv4 139352 0t0 TCP prometheusserver:52262->prometheusserver:websm (ESTABLISHED)
firefox 11108 googlebigtable 170u IPv4 139353 0t0 TCP prometheusserver:52264->prometheusserver:websm (ESTABLISHED)
firefox 11108 googlebigtable 174u IPv4 139107 0t0 TCP prometheusserver:52276->prometheusserver:websm (ESTABLISHED)
prometheu 66341 root 5u IPv6 140386 0t0 TCP :websm (LISTEN)
prometheu 66341 root 7u IPv4 140388 0t0 TCP localhost:43598->localhost:websm (ESTABLISHED)
prometheu 66341 root 8u IPv6 140389 0t0 TCP localhost:websm->localhost:43598 (ESTABLISHED)
prometheu 66341 root 9u IPv6 137655 0t0 TCP prometheusserver:websm->prometheusserver:52254 (ESTABLISHED)
prometheu 66341 root 10u IPv6 138925 0t0 TCP prometheusserver:websm->prometheusserver:52258 (ESTABLISHED)
prometheu 66341 root 11u IPv6 138926 0t0 TCP prometheusserver:websm->prometheusserver:52260 (ESTABLISHED)
prometheu 66341 root 12u IPv6 138927 0t0 TCP prometheusserver:websm->prometheusserver:52262 (ESTABLISHED)
prometheu 66341 root 13u IPv6 139354 0t0 TCP prometheusserver:websm->prometheusserver:52264 (ESTABLISHED)
prometheu 66341 root 14u IPv6 139012 0t0 TCP localhost:60684->localhost:websm (ESTABLISHED)
prometheu 66341 root 15u IPv6 139013 0t0 TCP localhost:websm->localhost:60684 (ESTABLISHED)
prometheu 66341 root 16u IPv6 140502 0t0 TCP prometheusserver:websm->prometheusserver:52276 (ESTABLISHED)
[root@prometheusserver local]# ss -naltp |grep 9090
LISTEN 0 128 [::]:9090 [::]: users:(("prometheus",pid=66341,fd=5))
[root@prometheusserver local]#
PrometheusAgent192.168.207.134显示DOWN且提示connect:no route to host ,是因为192.168.207.134 这台主机上的还处于运行状态,拦截了192.168.207.133于它的通信,在192.168.207.134关闭防火墙后即可。
【以下操作在192.168.207.134上执行】
[root@localhost node_exporter-0.17.0.linux-amd64]# firewall-cmd --state
running
[root@localhost node_exporter-0.17.0.linux-amd64]# systemctl stop firewalld.service
[root@localhost node_exporter-0.17.0.linux-amd64]# firewall-cmd --state
not running
[root@localhost node_exporter-0.17.0.linux-amd64]# hostname
prometheusagent
[root@localhost node_exporter-0.17.0.linux-amd64]#
{Agent上的操作}
[googlebigtable@localhost ~]$ su - root
Password:
[root@localhost ~]# mv /etc/yum.repos.d/CentOS-Base.repo /etc/yum.repos.d/CentOS-Base.repo.original
[root@localhost ~]# wget -O /etc/yum.repos.d/CentOS-Base.repo http://mirrors.163.com/.help/CentOS7-Base-163.repo
--2020-05-29 12:13:06-- http://mirrors.163.com/.help/CentOS7-Base-163.repo
Resolving mirrors.163.com (mirrors.163.com)... 59.111.0.251
Connecting to mirrors.163.com (mirrors.163.com)|59.111.0.251|:80... connected.
HTTP request sent, awaiting response... 200 OK
Length: 1572 (1.5K) [application/octet-stream]
Saving to: ‘/etc/yum.repos.d/CentOS-Base.repo’
100%[================================================================================================>] 1,572 --.-K/s in 0s
2020-05-29 12:13:06 (455 MB/s) - ‘/etc/yum.repos.d/CentOS-Base.repo’ saved [1572/1572]
[root@localhost ~]# yum clean all
Loaded plugins: fastestmirror, langpacks
Existing lock /var/run/yum.pid: another copy is running as pid 12130.
Another app is currently holding the yum lock; waiting for it to exit...
The other application is: PackageKit
Memory : 129 M RSS (473 MB VSZ)
Started: Fri May 29 12:13:10 2020 - 00:30 ago
State : Sleeping, pid: 12130
Another app is currently holding the yum lock; waiting for it to exit...
The other application is: PackageKit
Memory : 129 M RSS (473 MB VSZ)
Started: Fri May 29 12:13:10 2020 - 00:32 ago
State : Sleeping, pid: 12130
^C
Exiting on user cancel.
[root@localhost ~]# kill -9 12130
[root@localhost ~]# yum clean all
BDB2053 Freeing read locks for locker 0xbc1: 12130/139666126149440
BDB2053 Freeing read locks for locker 0xbc3: 12130/139666126149440
Loaded plugins: fastestmirror, langpacks
Cleaning repos: base extras updates
Cleaning up list of fastest mirrors
[root@localhost ~]# yum makecache
Loaded plugins: fastestmirror, langpacks
Determining fastest mirrors
base | 3.6 kB 00:00:00
extras | 2.9 kB 00:00:00
updates | 2.9 kB 00:00:00
(1/10): base/7/x86_64/group_gz | 153 kB 00:00:00
(2/10): base/7/x86_64/primary_db | 6.1 MB 00:00:03
(3/10): extras/7/x86_64/primary_db | 194 kB 00:00:00
(4/10): extras/7/x86_64/other_db | 122 kB 00:00:00
(5/10): extras/7/x86_64/filelists_db | 205 kB 00:00:00
(6/10): base/7/x86_64/filelists_db | 7.1 MB 00:00:04
(7/10): updates/7/x86_64/primary_db | 1.3 MB 00:00:00
(8/10): updates/7/x86_64/filelists_db | 980 kB 00:00:01
(9/10): updates/7/x86_64/other_db | 183 kB 00:00:00
(10/10): base/7/x86_64/other_db | 2.6 MB 00:00:01
Metadata Cache Created
[root@localhost ~]# hostnamectl set-hostname prometheusagent
[root@localhost ~]# hostnamectl status
Static hostname: prometheusagent
Icon name: computer-vm
Chassis: vm
Machine ID: bf9679c386d84fc5a5e527356bdeb7dd
Boot ID: 7d5a1b5b8cef41a7a0d4747d1c035d86
Virtualization: vmware
Operating System: CentOS Linux 7 (Core)
CPE OS Name: cpe:/o:centos:centos:7
Kernel: Linux 3.10.0-957.el7.x86_64
Architecture: x86-64
[root@localhost ~]# yum -y update
Loaded plugins: fastestmirror, langpacks
Loading mirror speeds from cached hostfile
Resolving Dependencies
.....................................................................................................
Complete!
[root@localhost ~]#
我自己已经将Agent组件node_exporter从GitHub下载到了本地,并上传到了腾讯微云存储,地址是https://www.weiyun.com/disk
[root@localhost ~]# cp /home/googlebigtable/Downloads/node_exporter-0.17.0.linux-amd64.tar.gz .
[root@localhost ~]# ls -F
anaconda-ks.cfg initial-setup-ks.cfg node_exporter-0.17.0.linux-amd64.tar.gz
[root@localhost ~]# tar -xzvf node_exporter-0.17.0.linux-amd64.tar.gz -C /usr/local/
node_exporter-0.17.0.linux-amd64/
node_exporter-0.17.0.linux-amd64/NOTICE
node_exporter-0.17.0.linux-amd64/node_exporter
node_exporter-0.17.0.linux-amd64/LICENSE
[root@localhost ~]# cd /usr/local/
[root@localhost local]# ls -F
bin/ etc/ games/ include/ lib/ lib64/ libexec/ node_exporter-0.17.0.linux-amd64/ sbin/ share/ src/
[root@localhost local]# ln -sv /usr/local/node_exporter-0.17.0.linux-amd64/ /usr/local/Node_exporter
‘/usr/local/Node_exporter’ -> ‘/usr/local/node_exporter-0.17.0.linux-amd64/’
[root@localhost local]# ls -F
bin/ etc/ games/ include/ lib/ lib64/ libexec/ Node_exporter@ node_exporter-0.17.0.linux-amd64/ sbin/ share/ src/
[root@localhost local]# cd node_exporter-0.17.0.linux-amd64/
[root@localhost node_exporter-0.17.0.linux-amd64]# ls -F
LICENSE node_exporter* NOTICE
[root@localhost node_exporter-0.17.0.linux-amd64]# nohup /usr/local/node_exporter-0.17.0.linux-amd64/node_exporter &
[1] 109778
[root@localhost node_exporter-0.17.0.linux-amd64]# nohup: ignoring input and appending output to ‘nohup.out’
[root@localhost node_exporter-0.17.0.linux-amd64]# lsof -i:9100
COMMAND PID USER FD TYPE DEVICE SIZE/OFF NODE NAME
node_expo 109778 root 3u IPv6 204547 0t0 TCP :jetdirect (LISTEN)
[root@localhost node_exporter-0.17.0.linux-amd64]# ss -naltp |grep 9100
LISTEN 0 128 [::]:9100 [::]: users:(("node_exporter",pid=109778,fd=3))
[root@localhost node_exporter-0.17.0.linux-amd64]# ifconfig -a
ens33: flags=4163
inet 192.168.207.134 netmask 255.255.255.0 broadcast 192.168.207.255
inet6 fe80::f8ba:993a:6b40:cdb2 prefixlen 64 scopeid 0x20
ether 00:0c:29:3c:5f:2c txqueuelen 1000 (Ethernet)
RX packets 788196 bytes 1133879467 (1.0 GiB)
RX errors 0 dropped 0 overruns 0 frame 0
TX packets 366248 bytes 22571490 (21.5 MiB)
TX errors 0 dropped 0 overruns 0 carrier 0 collisions 0
lo: flags=73
inet 127.0.0.1 netmask 255.0.0.0
inet6 ::1 prefixlen 128 scopeid 0x10
loop txqueuelen 1000 (Local Loopback)
RX packets 70 bytes 5868 (5.7 KiB)
RX errors 0 dropped 0 overruns 0 frame 0
TX packets 70 bytes 5868 (5.7 KiB)
TX errors 0 dropped 0 overruns 0 carrier 0 collisions 0
virbr0: flags=4099
inet 192.168.122.1 netmask 255.255.255.0 broadcast 192.168.122.255
ether 52:54:00:38:57:30 txqueuelen 1000 (Ethernet)
RX packets 0 bytes 0 (0.0 B)
RX errors 0 dropped 0 overruns 0 frame 0
TX packets 0 bytes 0 (0.0 B)
TX errors 0 dropped 0 overruns 0 carrier 0 collisions 0
virbr0-nic: flags=4098
ether 52:54:00:38:57:30 txqueuelen 1000 (Ethernet)
RX packets 0 bytes 0 (0.0 B)
RX errors 0 dropped 0 overruns 0 frame 0
TX packets 0 bytes 0 (0.0 B)
TX errors 0 dropped 0 overruns 0 carrier 0 collisions 0
[root@localhost node_exporter-0.17.0.linux-amd64]#
[root@localhost node_exporter-0.17.0.linux-amd64]# cat -n /etc/hosts
1 127.0.0.1 localhost localhost.localdomain localhost4 localhost4.localdomain4
2 ::1 localhost localhost.localdomain localhost6 localhost6.localdomain6
[root@localhost node_exporter-0.17.0.linux-amd64]# echo "192.168.207.133 prometheusserver" >> /etc/hosts
[root@localhost node_exporter-0.17.0.linux-amd64]# echo "192.168.207.134 prometheusagent" >> /etc/hosts
[root@localhost node_exporter-0.17.0.linux-amd64]# cat -n /etc/hosts
1 127.0.0.1 localhost localhost.localdomain localhost4 localhost4.localdomain4
2 ::1 localhost localhost.localdomain localhost6 localhost6.localdomain6
3 192.168.207.133 prometheusserver
4 192.168.207.134 prometheusagent
[root@localhost node_exporter-0.17.0.linux-amd64]# firewall-cmd --state
running
[root@localhost node_exporter-0.17.0.linux-amd64]# systemctl stop firewalld.service
[root@localhost node_exporter-0.17.0.linux-amd64]# firewall-cmd --state
not running
[root@localhost node_exporter-0.17.0.linux-amd64]# hostname
prometheusagent
[root@localhost node_exporter-0.17.0.linux-amd64]#
【也可以在启动node_exporter服务前执行一次重启,是先前设置的关闭防火墙和SELinux生效】
以下是监控展示界面:
孟伯,20200529
交流联系:微信 1807479153 ,QQ 1807479153