用R画中国地图
如何画中国地图
install.packages("maps")
install.packages("mapdata")
install.packages("maptools")
library(maps)
library(mapdata)
library(maptools)
setwd("D:\\Documents\\work\\myself_learn\\地图")
map<-readShapePoly('bou2_4p.shp')
plot(map)
bou2_4p.shp是什么鬼?
是中国行政区地图的数据信息其中一个文件。
中国行政区地图的数据信息包括三个文件bou2_4p.dbf,bou2_4p.shp和bou2_4p.shx
怎么获取?
http://cos.name/wp-content/uploads/2009/07/chinaprovinceborderdata_tar_gz.zip下载,解压缩
最近画的两个地图
#################用echart作图###############################
library(devtools)
#install_github('lchiffon/REmap')
library(REmap)
setwd("D:\\Documents\\work\\myself_learn\\地图")
city_vec = c("Beijing","Shanghai","Guangzhou")
get_city_coord("Beijing")
get_city_coord("beijing")
get_city_coord("北京")
get_city_coord( c("Beijing","Shanghai","Guangzhou")) #报错,只能填写单个,不能是向量
get_geo_position (c("beijing","Shanghai","广州","新疆"))
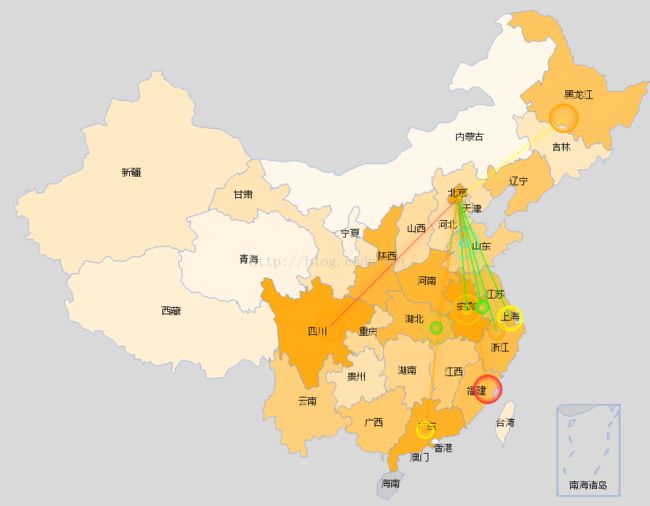
##################remap迁徙地图############
#remap 中文不稳定
#data 要求2列:一列出发省份,另一列到达省份
migrate_map_data<-read.csv("迁徙地图数据.csv",stringsAsFactors=FALSE)
origin<-c("shanghai","jiangsu","anhui","zhejiang","shandong","hubei","guangzhou","heilongjiang","sichuan","fujian")
destination<-rep("beijing",10)
migrate_map_data1<-as.data.frame(cbind(origin,destination))
remap(migrate_map_data1, title = "Draw by 小酥饼maomao", subtitle = "",
theme =get_theme("Dark")) ##中英文均可

migrate_map_data2<-as.data.frame(cbind(destination,origin))
remap(migrate_map_data2, title = "", subtitle = "",
theme = get_theme("Dark")) 
origin = c("beijing","shanghai","sichuan")
destination = c('shanghai','sichuan','beijing')
dat = data.frame(origin,destination)
remap(dat,title = "REmap实例数据",subtitle = "theme:Dark")
#主题设置
#“Dark”,“Bright,”Sky“,”none“,none 为 自定义
remap(migrate_map_data2,title = "REmap实例数据",subtitle = "theme:Dark",
      theme = get_theme("Dark"))

remap(migrate_map_data2,title = "REmap实例数据",subtitle = "theme:Dark",
      theme = get_theme("none",
                        lineColor = "orange",
                        backgroundColor = "pink",
                        titleColor = "red",
                        borderColor = "white",
                        regionColor = "green"))
#######################remapC分级统计图##############################
#data 要求两列:第一列省份,第二列数值
#maptype 选择:china or world or 省份(广东、西藏)
choropleth_map_data<-read.csv("分区域热力地图.csv",stringsAsFactors=FALSE)
remapC(choropleth_map_data,
       color = 'orange')
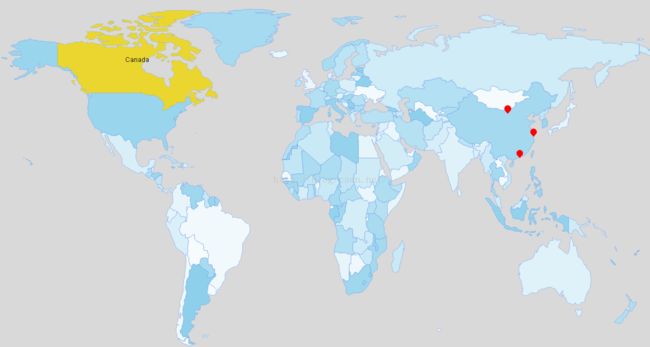
#世界地图
data = data.frame(country = mapNames("world"),value = 5*sample(178)+200)
head(data)
remapC(data,maptype = "world",color = 'skyblue')
#省份地图
data = data.frame(country = mapNames('浙江'),value = 50*sample(11)+200,stringsAsFactors = F)
data$value<-as.numeric(data$value)
remapC(data,maptype = '浙江',color = 'skyblue')
#只画地图
remapC(choropleth_map_data,
       title = "remapC实例地图",
       theme = get_theme('none',backgroundColor = '#fff',
                         titleColor = "#1b1b1b",
                         pointShow = T),
       max = 2000)
#地图基础上添加路径
#remapC(data,maptype = 'china',color = c('#1e90ff','#f0ffff'),
#       theme = get_theme("Bright"),
#       title = "",subtitle = "",
#       mindata = NA,maxdata = NA,geoData = NA,
#       #添加路径数据,格式
#       markLineData = NA,markPointData = NA,
#       markLineTheme = markLineControl(),markPointTheme = markPointControl())
markline_control<-markLineControl(symbolSize = c(0,0),  #是否有箭头
                                  smooth = F,
                                  smoothness = 0,       #退化为直线
                                  effect = F,           #炫光效果
                                  lineWidth = 1,        #标线宽度
                                  lineType = "solid")   #标线样式 solid dotted dashed
##markLineControl 的color 默认为随机颜色,设置一个颜色会取为固定颜色
markpoint_control<-markPointControl(symbol = "Circle",
                                    symbolSize = 10,    #标点大小
                                    effect=T,           #炫光效果
                                    effectType="scale") #炫光方式:’scale’放大,’bounce’跳动
#symbol:
#‘circle’,‘emptyCircle’,圆,空心圆
#‘rectangle’,‘emptyRectangle’,方块,空心方块
#‘triangle’,‘emptyTriangle’,三角,空心三角
#‘diamond’,‘emptyDiamond’,钻石,空心钻石
#‘heart’心形,’droplet’,水滴
#‘pin’,POI标注,’arrow’箭头, ’star’五角星
#或者使用’image://http://….’来引用一个图片,如symbol = "image://http://lchiffon.github.io/assets/images/df_logo.jpg",
#此外对markLineData下设置symbol变量会覆盖该颜色

remapC(choropleth_map_data,
       color = 'orange',
       markLineData = migrate_map_data2,
       markPointData = migrate_map_data2[,2],
       markLineTheme=markline_control,
       markPointTheme=markpoint_control)
remapC(choropleth_map_data,
       color = 'orange',
       markPointData = migrate_map_data2[,2],
markPointTheme=markpoint_control) 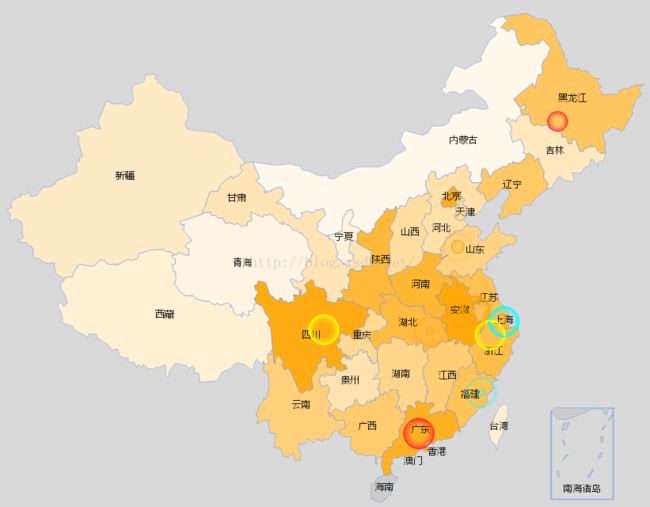
#位置标记
data = data.frame(country = mapNames('上海'),value = 50*sample(19)+200,stringsAsFactors = F)
data$value<-as.numeric(data$value)
pointData = data.frame(geoData$name,
                       color = c(rep("orange",20),
                                 rep("red",10)))
remapC(data,maptype = '上海',color = 'skyblue',
       markPointData = pointData,
       markPointTheme = markPointControl(symbol = 'pin',
                                         symbolSize = 5,
                                         effect = F),
       geoData = geoData)  #上海火锅店
##################remapB####################
#那个蓝蓝的背景,真心丑啦~~
markline_data<-data.frame(origin=rep("shanghai",14),
                          destination=c("jiangsu","anhui","zhejiang","beijing","shandong","hubei","guangdong","heilongjiang","sichuan","fujian","hunan","henan","liaoning","jiangxi"),
                          color=rep("red",14))   #作线条用

remapB(title = "Bmap 迁徙图示例",
         color = "Blue",
         markLineData = migrate_map_data2,
         markPointData = migrate_map_data2[,2])
###################disney景区分布############################
library(baidumap)
getCoordinate('北京大学') # json
getCoordinate('北京大学', output='xml') # xml
getCoordinate('北京大学', formatted = T) # character
getCoordinate('Harvard University', formatted = T) # 百度没添加国外的经纬度,哭泣ing
disney<-getCoordinate(c('上海迪士尼乐园', '香港迪士尼乐园',"东京迪士尼乐园","巴黎迪士尼乐园","洛杉矶迪士尼乐园","奥兰多迪士尼乐园"), formatted = T) # matrix
plotdata = data.frame(lon = disney[,1],
                      lat = disney[,2],
                      city = rownames(disney))
data = data.frame(country = mapNames("world"),value = 5*sample(178)+200)

remapC(data,maptype = "world",color = 'skyblue',
       markPointData = data.frame(plotdata$city),
       markPointTheme = markPointControl(symbol = "pin",
                                         effect=F,
                                         symbolSize = 5,
                                         color="red"),
       geoData = plotdata)
#国外的迪士尼都出错了
这是一篇我跟了一年的文章《R语言天气可视化应用》,好牛逼的技术,努力学习ing,先mark下
http://blog.fens.me/r-app-china-weather/?replytocom=2903
http://blog.sina.com.cn/s/blog_670445240102v20c.html