python3,matplotlib绘图,title、xlabel、ylabel、图例等出现中文乱码
1、有乱码问题的代码如下
import pandas as pd
import numpy as np
import matplotlib.pyplot as plt
file=“4.0datatxt/kz.csv”
df=pd.read_csv(file,header=None)
plt.figure()
x=df.iloc[0:,[1,2]].values
plt.scatter(x[0:,0],x[0:,1],color=‘red’,marker=‘o’,label=“裤子”)
plt.xlabel(“展现量”)
plt.ylabel(“点击量”)
plt.legend(loc=“best”)
plt.show()
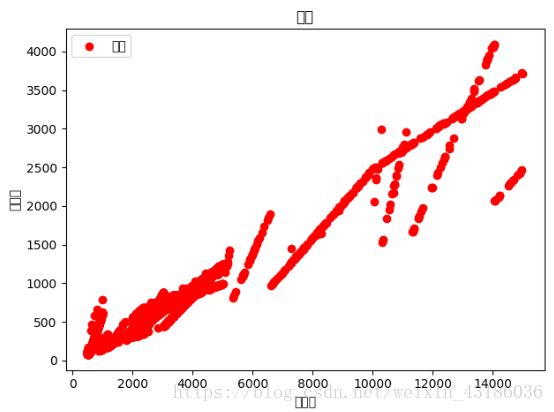
2、运行结果如下图,其中,中文都为乱码。

3、原因
matplotlib.pyplot在显示时无法找到合适的字体,默认的使用的字体里没有中文,要在有中文的地方加上中文相关的字体,不然会因为没有字体显示成放框。
先把需要的字体(在系统盘C盘的windows下的fonts目录内)添加到FontProperties中。
另外说明:python3使用matplotlib画图,因python3默认使用中unicode编码。所以在写代码时不再需要写 plt.xlabel(u’ 展现量’),而是直接写plt.xlabel(‘展现量’)
4、解决办法
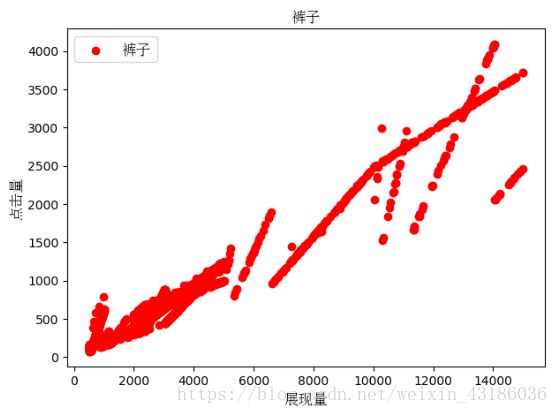
(1)加入和修改代码如下:
from matplotlib.font_manager import FontProperties
font_set = FontProperties(fname=r"c:\windows\fonts\simsun.ttc", size=12)
……
scatter(x[0:,0],x[0:,1],color=‘red’,marker=‘o’,label=“裤子”)
plt.xlabel(“展现量”,fontproperties=font_set)
plt.ylabel(“点击量”,fontproperties=font_set)
plt.legend(prop=font_set,loc=“best”)
#plt.legend(loc=“upper left”)
plt.title(‘裤子’, fontproperties=font_set)
(2)修改后完整代码如下
import pandas as pd
import numpy as np
import matplotlib.pyplot as plt
from matplotlib.font_manager import FontProperties
font_set = FontProperties(fname=r"c:\windows\fonts\simsun.ttc", size=12)
file=“4.0datatxt/kz.csv”
df=pd.read_csv(file,header=None)
plt.figure()
x=df.iloc[0:,[1,2]].values
plt.scatter(x[0:,0],x[0:,1],color=‘red’,marker=‘o’,label=“裤子”)
plt.xlabel(“展现量”,fontproperties=font_set)
plt.ylabel(“点击量”,fontproperties=font_set)
plt.legend(prop=font_set,loc=“best”)
#plt.legend(loc=“upper left”)
plt.title(‘裤子’, fontproperties=font_set)
plt.show()
