zabbix
一 zabbix的介绍
Zabbix 是一款功能强大的分布式开源监控系统,线上用的也比较多,个人感觉是 cacti 和 nagios
的整合,又天生自带分布式监控,大批量主机运维监控优势明显,废话不多说,直接上干货。
二实验步骤
1)zabbix server端需要简单的lnmp架构
1 软件的安装(server1 )rhel7.3
yum install -y zabbix-agent-3.4.6-1.el7.x86_64.rpm
zabbix-server-mysql-3.4.6-1.el7.x86_64.rpm
zabbix-web-3.4.6-1.el7.noarch.rpm
zabbix-web-mysql-3.4.6-1.el7.noarch.rpm
php-mbstring-5.4.16-42.el7.x86_64.rpm
php-bcmath-5.4.16-42.el7.x86_64.rpm
fping-3.10-1.el7.x86_64.rpm
iksemel-1.4-2.el7.centos.x86_64.rpm
2 mysql数据库配置
yum install -y mariadb-server
systemctl start mariadb
mysql
mysql> create database zabbix character set utf8 collate utf8_bin;
mysql> grant all privileges on zabbix.* to zabbix@localhost identified by 'james';
mysql> quit;
cd /usr/share/doc/zabbix-server-mysql-3.4.6/
zcat create.sql.gz | mysql -uzabbix -pjames zabbix
3 配置php
vim /etc/httpd/conf.d/zabbix.conf
php_value max_execution_time 300
php_value memory_limit 128M
php_value post_max_size 16M
php_value upload_max_filesize 2M
php_value max_input_time 300
php_value date.timezone Asia/Shanghai
4 配置zabbix server
vim /etc/zabbix/zabbix_server.conf
DBHost=localhost
DBName=zabbix
DBUser=zabbix
DBPassword=james
5 启动服务
systemctl start zabbix-server
systemctl start zabbix-agent
systemctl start httpd
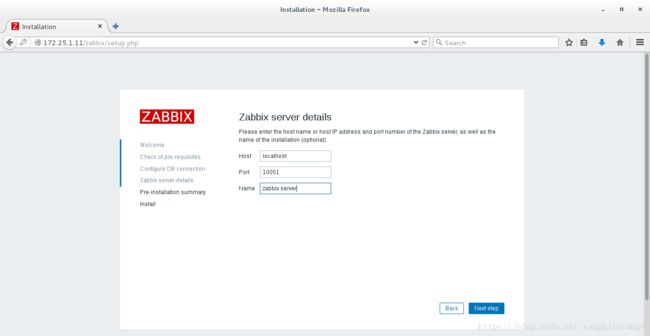
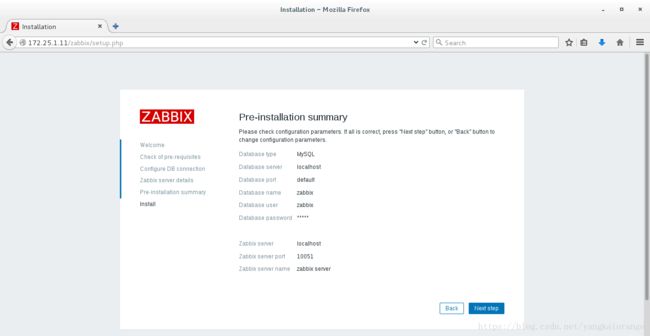
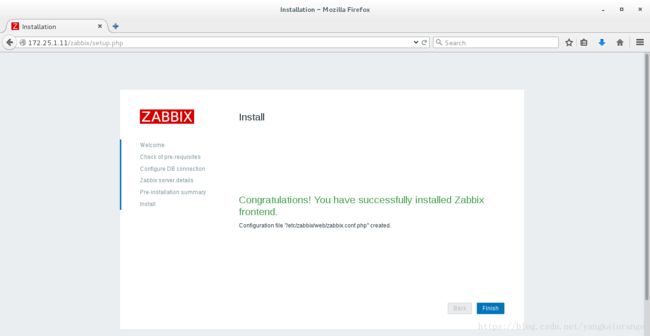
6 访问测试

点击下一步
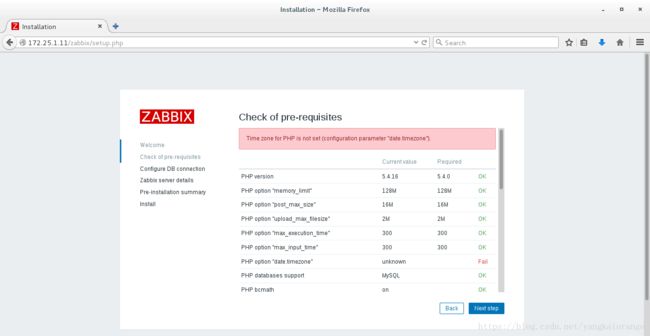
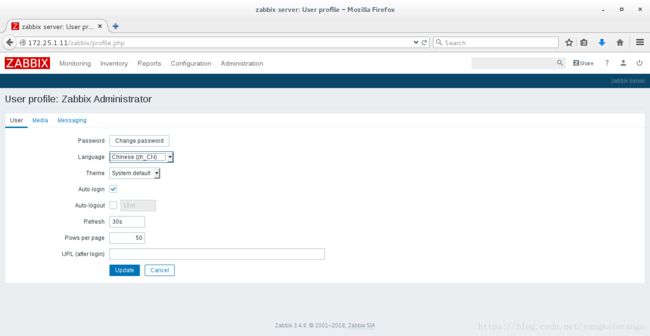
发现时区没有修改
vim /etc/php.ini
date.timezone = Asia/Shanghai
systemctl restart zabbix-server.service
systemctl restart zabbix-agent.service
systemctl restart httpd
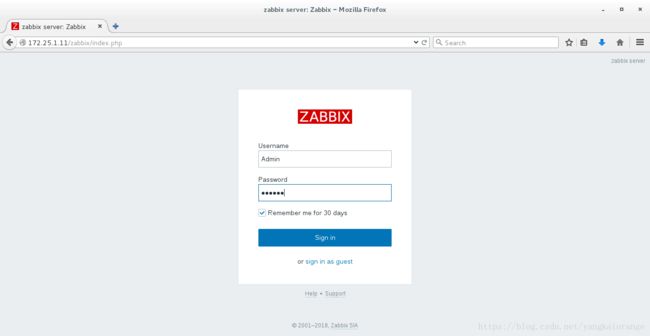
刷新页面


2 zabbix-agent(server2)配置 rhel6.5
1 )软件的安装
yum install -y zabbix-agent-3.4.6-1.el6.x86_64.rpm
2 )软件的配置
vim /etc/zabbix/zabbix_agentd.conf
Server=172.25.1.11  #指向agent-server
ServerActive=172.25.1.11
Hostname=server2
/etc/init.d/zabbix-agent start
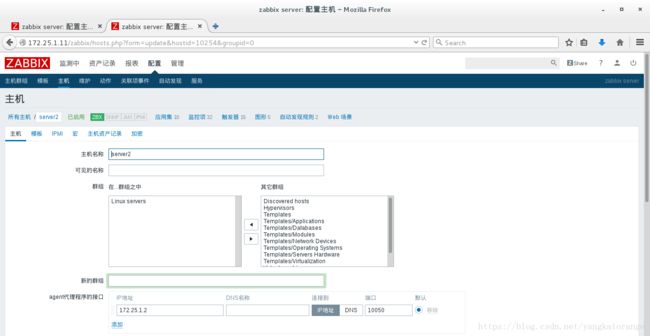
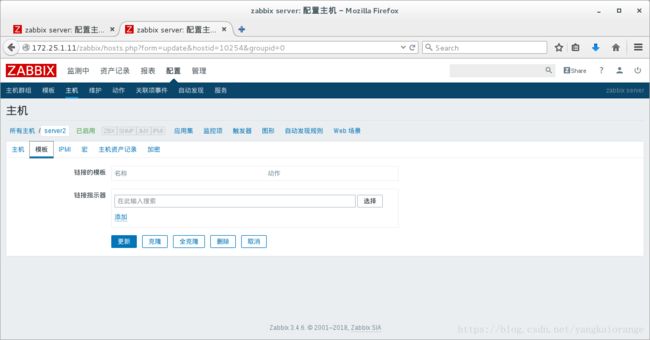
3 )在zabbix客户端进行设置
3 自动发现
测试:
1 )把server2删掉

2 )查看自动发现规则

3 )在动作里增加事件源 自动发现
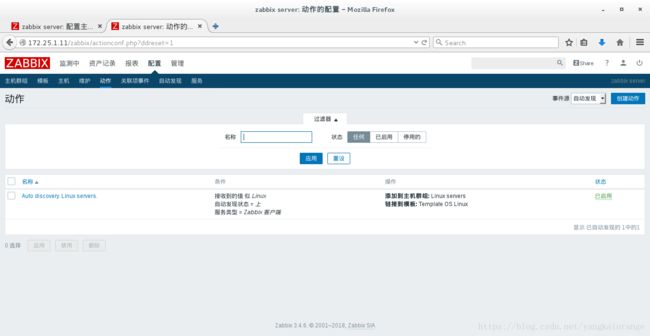
4 )更改自动发现规则ip范围

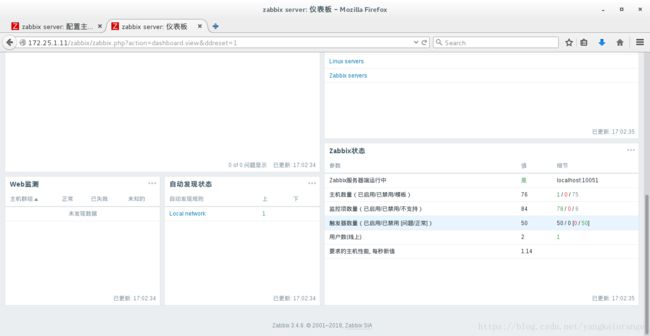
5 )查看仪表板
[root@server2 zabbix]# /etc/init.d/zabbix-agent restart
Shutting down Zabbix agent: [ OK ]
Starting Zabbix agent: [ OK ]
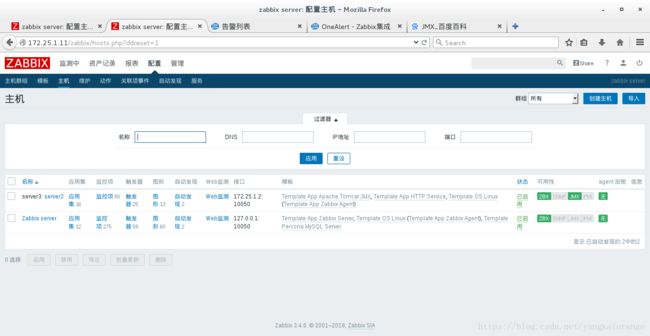
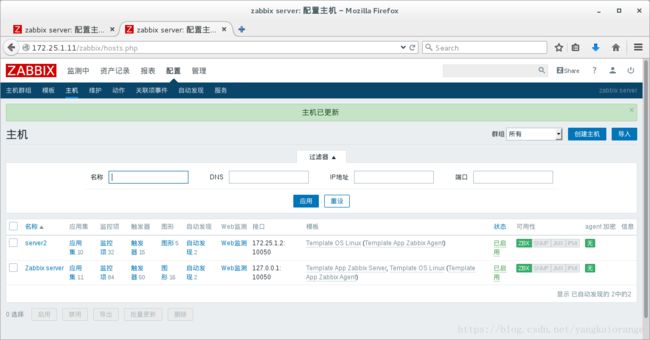
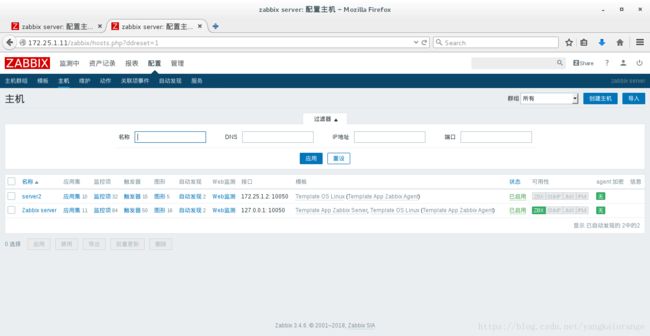
6 )查看主机

4 自动注册
在测试前禁用自动发现规则


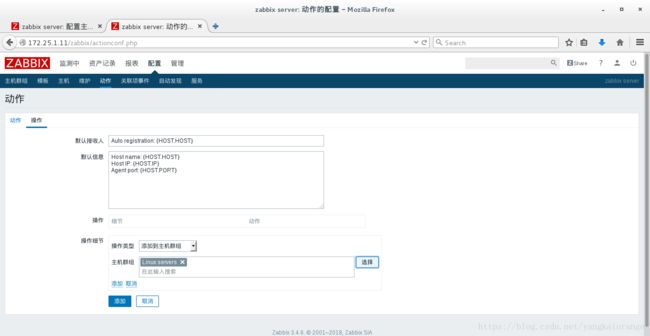
1 )重新创建动作

2 )将动作添加到主机群组里
 3 )将动作链接到主机模板中

4 )添加之后重启server2 服务
5 通过api接口来添加主机
编写脚本:
vim zabbix.api
curl -s -X POST -H 'Content-Type: application/json' -d '
{
    "jsonrpc":"2.0",
    "method":"user.login",
    "params": {
        "user":"Admin",
        "password": "zabbix"
     },
    "id":1,
    "auth":null
}' http://172.25.1.11/zabbix/api_jsonrpc.php | python -m json.tool
~
chmod +x zabbix.api
[root@server1 ~]# ./zabbix.api
{
"id": 1,
"jsonrpc": "2.0",
"result": "0da78f6bf47f0c193b79b09b0a6fd4b1"
}
1 )实验刚才的测试 把server2 删除掉,通过api脚本自动添加
编辑脚本 vim zabbix.api
curl -s -X POST -H 'Content-Type: application/json' -d '
{
    "jsonrpc":"2.0",
    "method":"host.create",
    "params": {
          "host":"server2",
          "interfaces":[
       {
          "type":1,
          "main":1,
          "useip":1,
          "ip":"172.25.1.2",
          "dns":"",
          "port":"10050"
        }
     ],
    "groups": [
      {
        "groupid":"2"
      }
     ],
    "templates": [
      {
         "templateid":"10001"
      }
   ]
      },
    "id":1,
    "auth":"0da78f6bf47f0c193b79b09b0a6fd4b1"
}' http://172.25.1.11/zabbix/api_jsonrpc.php | python -m json.tool
[root@server1 ~]# ./zabbix.api
{
"id": 1,
"jsonrpc": "2.0",
"result": {
"hostids": [
"10257"
]
}
}
[root@server1 ~]#

可以看出成功了!
6 监控apache服务
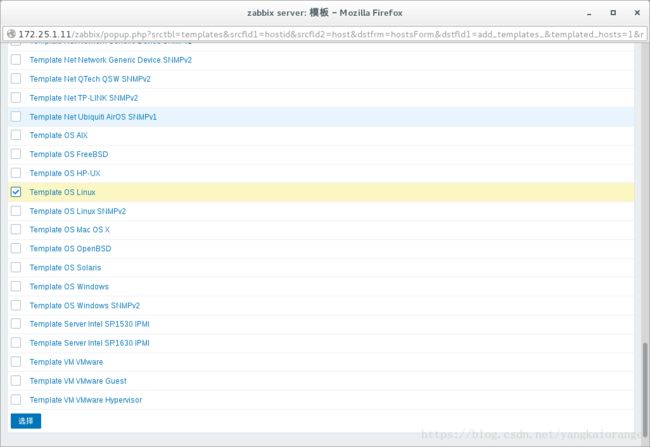
1 )添加模版

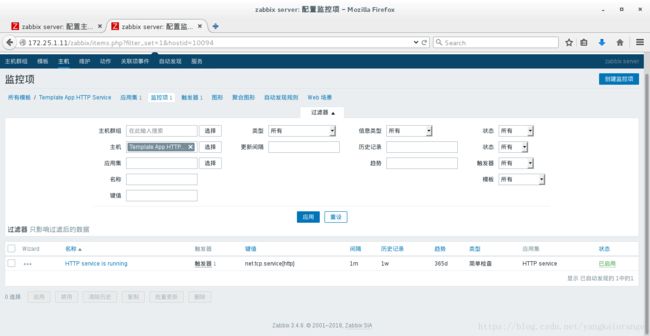
2 )查看监控项
7 监控nginx 服务
1 ) 安装软件
rpm -ivh nginx-1.8.0-1.el6.ngx.x86_64.rpm
2 )在配置文件中增加以下配置
vim /etc/nginx/conf.d/default.conf
  # redirect server error pages to the static page /50x.html
    #
    error_page   500 502 503 504  /50x.html;
    location = /50x.html {
        root   /usr/share/nginx/html;
    }
    location /status {
        stub_status on;
        access_log off;
    }
    # proxy the PHP scripts to Apache listening on 127.0.0.1:80
    #
[root@server2 conf.d]# nginx -t
nginx: the configuration file /etc/nginx/nginx.conf syntax is ok
nginx: configuration file /etc/nginx/nginx.conf test is successful
[root@server2 conf.d]# /etc/init.d/nginx start
Starting nginx: [ OK ]
[root@server2 conf.d]#
3 ) 访问测试

4 )最好增加访问控制
vim default.conf
location /status {
        stub_status on;
        access_log off;
        allow 127.0.0.1
        deny all;
    }
root@server2 conf.d]# nginx -t
nginx: the configuration file /etc/nginx/nginx.conf syntax is ok
nginx: configuration file /etc/nginx/nginx.conf test is successful
[root@server2 conf.d]# /etc/init.d/nginx restart
Stopping nginx:                                            [  OK  ]
Starting nginx:                                            [  OK  ]
5 )添加zabbix的nginx的配置文件
cd /etc/zabbix/zabbix_agentd.d/
[root@server2 zabbix_agentd.d]# cp userparameter_mysql.conf userparameter_nginx.conf
[root@server2 zabbix_agentd.d]# ls
userparameter_mysql.conf  userparameter_nginx.conf
[root@server2 zabbix_agentd.d]#
vim userparameter_nginx.conf
UserParameter=nginx.active,curl -s  http://127.0.0.1/status | grep Active |awk '{print $3}'
UserParameter=nginx.accept,curl -s  http://127.0.0.1/status | awk NR==3 |awk '{print $1}'
UserParameter=nginx.request,curl -s  http://127.0.0.1/status | awk NR==3 |awk '{print $3}'
root@server2 zabbix_agentd.d]# /etc/init.d/zabbix-agent restart
Shutting down Zabbix agent: [ OK ]
Starting Zabbix agent: [ OK ]
6 )增加监控项

在server端也可以查看nginx的状态
[root@server1 zabbix]# zabbix_get -s 172.25.1.2 -p 10050 -k "nginx.active"
1
创建图形在监控页面查看
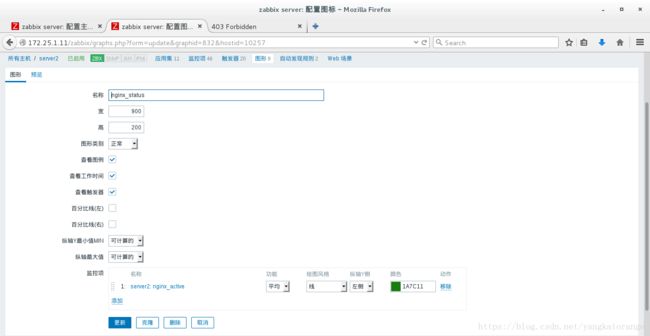

同样的操作添加监控项
nginx.accept
nginx.request

8 监控mysql服务
在/etc/zabbix/zabbix_agentd.d/userparameter_mysql.conf 文件中指定了 zabbix agent 如何获取 mysql
服务的各种信息,并在/var/lib/zabbix 目录中新建“.my.cnf”文件,用以指定 zabbix agent 如何登陆数据库,默认使用的是 zabbix 用户,可以在 zabbix_server.conf 文件中找到密码。
mkdir /var/lib/zabbix/
vim .my.cnf
[mysql]
user=zabbix
password=james
socket=/var/lib/mysql/mysql.sock

[mysqladmin]
user=zabbix
password=james
socket=/var/lib/mysql/mysql.sock
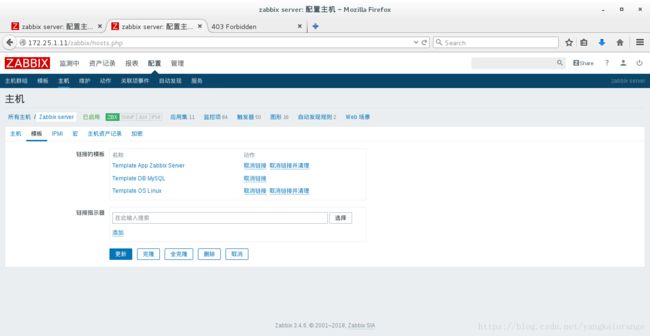
链接模版
查看图形

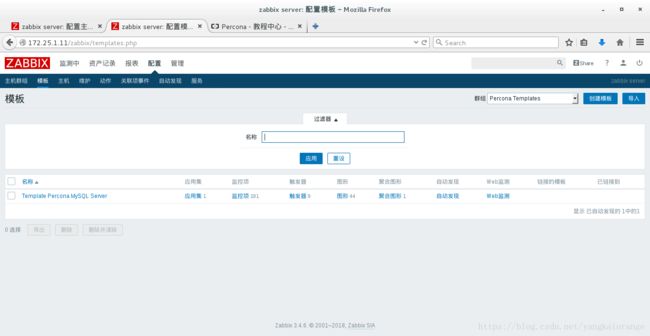
上述是zabbix自带的监控模版,我们为了更加详细监控mysql的状态需加入percona-zabbix-templates插件模版
安装rpm包
rpm -ivh percona-zabbix-templates-1.1.8-1.noarch.rpm
cd /var/lib/zabbix/percona/templates![]()
查看percona的配置文件,并把与mysql相关的配置文件放到zabbix的配置目录下
cd /var/lib/zabbix/percona/scripts
cp userparameter_percona_mysql.conf /etc/zabbix/zabbix_agentd.d/
systemctl restart zabbix.agent
zabbix_get -s 127.0.0.1 -p 10050 -k "MySQL.Key-read-requests"
8
给mysql root用户密码
mysqladmin -uroot password james
[root@server1 templates]# mysql -uroot -pjames
Welcome to the MariaDB monitor.  Commands end with ; or \g.
Your MariaDB connection id is 27691
Server version: 5.5.44-MariaDB MariaDB Server

Copyright (c) 2000, 2015, Oracle, MariaDB Corporation Ab and others.

Type 'help;' or '\h' for help. Type '\c' to clear the current input statement.

MariaDB [(none)]>
修改/var/lib/zabbix/percona/scripts/ss_get_mysql_stats.php
vim ss_get_mysql_stats.php
$mysql_user = 'root';  #和数据库的用户密码一致
$mysql_pass = 'james';
$mysql_port = 3306;
$mysql_socket = NULL;
$mysql_flags = 0;
$mysql_ssl  = FALSE;   # Whether to use SSL to connect to MySQL.
$mysql_ssl_key  = '/etc/pki/tls/certs/mysql/client-key.pem';
$mysql_ssl_cert = '/etc/pki/tls/certs/mysql/client-cert.pem';
$mysql_ssl_ca   = '/etc/pki/tls/certs/mysql/ca-cert.pem';
$mysql_connection_timeout = 5;
systectl restart zabbis-agent
倒入percona-zabbix-templates的xml文件

查看模版
链接模版

查看图形会发现监控项和图形增加了许多更加方便监控

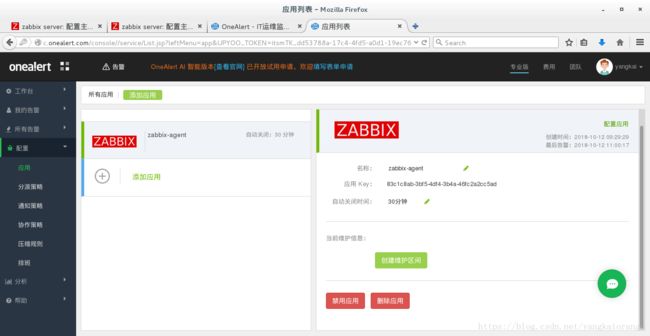
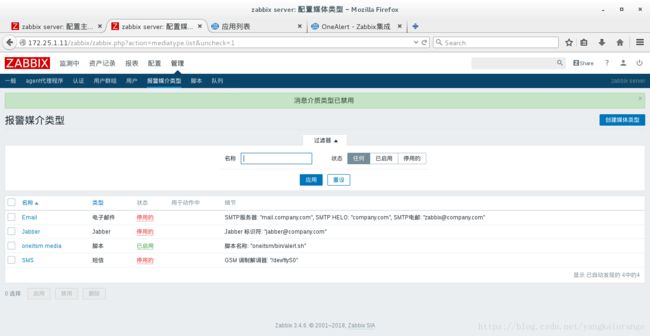
9 zbbix和云告警联合使用
添加应用
2 连网自动安装 可参考http://wiki.onealert.com/integration/zabbix-new.html
主机开启地址伪装
iptables -t nat -A POSTROUTING -s 172.25.1.11/24 -j MASQUERADE
server1
vim /etc/resolv.conf
nameserver 114.114.114.114
route add default gw 172.25.1.250 #主机内网ip
cd /usr/lib/zabbix/alertscripts/
tar zxf oneitsm_zabbix_release-1.2.0.tar.gz
cd oneitsm/bin/
./install.sh 83c1c8ab-3bf5-4df4-3b4a-46fc2a2cc5ad 这个key就是在上面创建应用时右边的key!
[root@server1 bin]# ./install.sh 83c1c8ab-3bf5-4df4-3b4a-46fc2a2cc5ad
./log.sh: line 6: /usr/lib/zabbix/alertscripts/oneitsm/bin/oneitsm.conf: No such file or directory
start to create config file...
Zabbix管理地址: http://172.25.1.11/zabbix/
Zabbix管理员账号: Admin
Zabbix管理员密码:
start to auth by zabbix admin user and password...
  % Total    % Received % Xferd  Average Speed   Time    Time     Time  Current
                                 Dload  Upload   Total   Spent    Left  Speed
100   195  100    70  100   125   1167   2085 --:--:-- --:--:-- --:--:--  2118
auth success!
  % Total    % Received % Xferd  Average Speed   Time    Time     Time  Current
                                 Dload  Upload   Total   Spent    Left  Speed
100   109  100    41  100    68    769   1276 --:--:-- --:--:-- --:--:--  1283
start to create mediatype...
  % Total    % Received % Xferd  Average Speed   Time    Time     Time  Current
                                 Dload  Upload   Total   Spent    Left  Speed
100   356  100    56  100   300    825   4422 --:--:-- --:--:-- --:--:--  4477
create media type success!
start to create user group...
  % Total    % Received % Xferd  Average Speed   Time    Time     Time  Current
                                 Dload  Upload   Total   Spent    Left  Speed
100   214  100    54  100   160    918   2722 --:--:-- --:--:-- --:--:--  2758
create user group success!
start to create user in zabbix...
  % Total    % Received % Xferd  Average Speed   Time    Time     Time  Current
                                 Dload  Upload   Total   Spent    Left  Speed
100   623  100    51  100   572    715   8025 --:--:-- --:--:-- --:--:--  8056
create user success!
start to create action...
  % Total    % Received % Xferd  Average Speed   Time    Time     Time  Current
                                 Dload  Upload   Total   Spent    Left  Speed
100  2013  100    51  100  1962    452  17398 --:--:-- --:--:-- --:--:-- 17517
create action success!
安装成功.
4.当提示"安装成功"时表示安装成功!
产生新的zabbix告警(problem),动作状态为“已送达”表示集成成功。
注:集成成功后不需要启动服务,可直接使用。()不需要重新启动
测试:
监控平台和zabbbix-agent链接超时会发送告警


10 JMX 监控系统
server1 -> server3-> server2
agent-server java-gw tomcat(agent)
server1
cd /etc/zabbix
vim zabbix_server.conf
JavaGateway= 172.25.39.3
JavaGatewayPort=10052
StartJavaPollers=5
systemctl restart zabbix-server.service


server3
yum install -y zabbix-java-gateway-3.4.6-1.el6.x86_64.rpm
/etc/init.d/zabbix-java-gateway start


server2
tar zxf apache-tomcat-7.0.90.tar.gz -C /usr/local/
cd /usr/local/
ln -s apache-tomcat-7.0.90/ tomcat
rpm -ivh jdk-8u121-linux-x64.rpm
cd /usr/local/tomcat/bin
vim catalina.sh
CATALINA_OPTS='-Dcom.sun.management.jmxremote
  -Dcom.sun.management.jmxremote.port=8888
  -Dcom.sun.management.jmxremote.ssl=false
  -Dcom.sun.management.jmxremote.authenticate=false'
在server主机中链接JMX接口
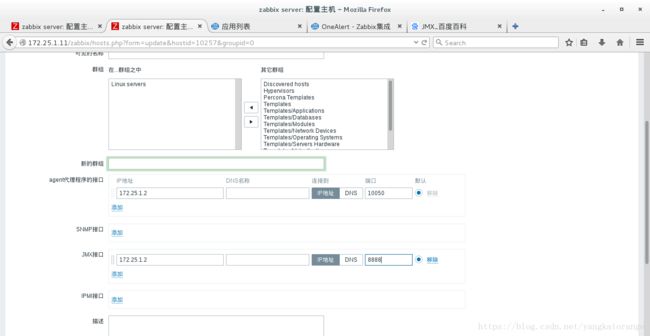
4 链接模版


11 zabbix的优化策略
整个监控系统分为监控的采集,监控的存储,监控的发布。在实验中zabbix的agent去采集报警,zabbix的server端去agent端拿数据并存储起来,然后通过php的脚本发布出去。在这整个过程中,zabbix server端的工作量很大,很容易造成阻塞的情况。那这个时候,我们就需要来优化这种情况。
server < proxy -> agent
server1 server3 server2
增加proxy就相当于增加了一个 zabbix的server ,proxy去agent端拿数据,拿完数据后自己存储后,然后发给server端。
server3
yum install -y fping-2.4b2-16.el6.x86_64.rpm zabbix-proxy-mysql-3.4.6-1.el6.x86_64.rpm
yum install -y mysql-server
cd /etc/zabbix
vim zabbix_proxy.conf

Server=172.25.1.11
Hostname=server3
DBPassword=james
JavaGateway=172.25.1.3
StartJavaPollers=5
[root@server3 zabbix]# mysql
Welcome to the MySQL monitor.  Commands end with ; or \g.
Your MySQL connection id is 2
Server version: 5.1.71 Source distribution

Copyright (c) 2000, 2013, Oracle and/or its affiliates. All rights reserved.

Oracle is a registered trademark of Oracle Corporation and/or its
affiliates. Other names may be trademarks of their respective
owners.

Type 'help;' or '\h' for help. Type '\c' to clear the current input statement.

mysql> create database zabbix_proxy character set utf8 collate utf8_bin;
Query OK, 1 row affected (0.00 sec)

mysql> grant all privileges on zabbix_proxy.* to zabbix@localhost identified by 'james';
Query OK, 0 rows affected (0.00 sec)

mysql> Bye


cd /usr/share/doc/zabbix-proxy-mysql-3.4.6
zcat schema.sql.gz | mysql -uzabbix -pjames zabbix_proxy
/etc/init.d/zabbix-proxy start

server2   #由于现在server3 相当于server端所以指向server3
cd /etc/zabbix
vim zabbix_agentd.conf
Server=172.25.1.3
ServerActive=172.25.1.3


server3
cd /var/log/zabbix
cat zabbix_proxy.log
agent 代理程序

查看主机