利用周末学R语言 (2) - 画图
准备工作
- 每次打开RStudio都应该先运行以下代码指定路径
setwd("d:/r/Rinaction")- 从txt/excel/数据库导出id/name/age/salary数据
df <- read.table("test.txt", sep="\t", header = TRUE)利用plot画图
- 三种看图的方式
# 在RStudio中查看图表
plot(df$id,df$salary,type='b')

# 在RStudio弹出窗口中中查看图表
dev.new()
  plot(df$id,df$salary,type='b')
dev.off()

# 将生成的图表保存为jpg图片
jpeg("test1.jpg")
plot(df$id,df$salary,type='b')
dev.off()- 图形的参数
# 备份默认参数
opar <- par(no.readonly = TRUE)
# 修改参数
par(lty=2, pch=17)
# 画图
plot(df$id,df$salary,type="b")
# 读取默认参数
par(opar)
# 也可在plot函数中指定参数
jpeg("test2.jpg")
plot(df$id,df$salary,type="b",
     pch=15,cex=2,lty=1,lwd=5)
dev.off()- 其他图形的参数见
- 官方文档-Graphical procedures
- 或者查看帮助
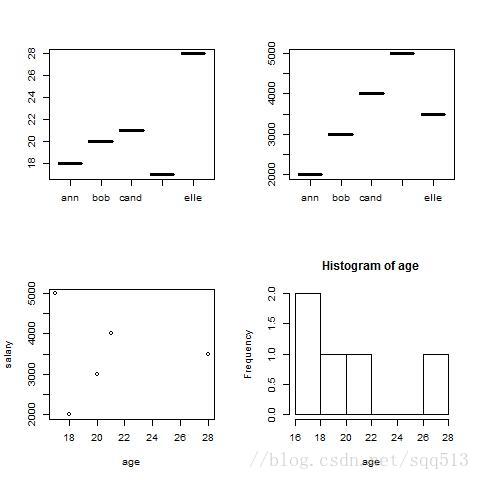
help(plot)- 图形的组合1
jpeg("test3.jpg")
attach(df)
opar <- par(no.readonly = TRUE)
par(mfrow=c(2,2))
plot(name, age)
plot(name, salary)
plot(age,salary)
hist(age)
par(opar)
detach(df)
dev.off()- 图形的组合2
jpeg("test4.jpg")
attach(df)
opar <- par(no.readonly = TRUE)
# matrix参数解释: c(图一占第1个和第2个位置,
# 图二放在第3个位置,图三放在第4个位置),2列,3行,位置一行一行的数
# widths和heights: 每一行和每一列的比例
layout(matrix(c(1,1,2,3),2,2,byrow=TRUE),
       widths = c(3,1),heights = c(1,2))
plot(name, age)
plot(name, age)
plot(name, age)
par(opar)
detach(df)
dev.off()
利用recharts画图
- recharts 提供了百度开源可视化js框架ECharts 4.0.0 的R语言接口
github项目地址
recharts的安装
install.packages("devtools")
# 如果下载速度慢/失败,可以尝试
# 1. 使用VPN
# 2. 在https://cran.r-project.org/web/packages/available_packages_by_name.html
#    中搜索下载并解压到 R\library
#    注意:需要安装的依赖包也只能自己手动一一安装

require(devtools)
# 通过github安装
devtools::install_github('cosname/recharts')- 从官网的官方实例中获取JS代码并运行
library(recharts)
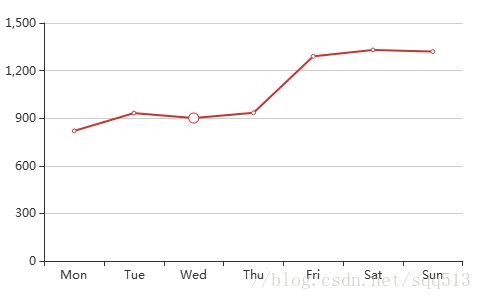
echartsExample("http://echarts.baidu.com/examples/editor.html?c=line-simple")- 基于源生JS代码执行echarts绘图
library(recharts)
JScodes = "
var option = {
title: {
text: 'test'
},
tooltip: {},
legend: {
data:['salary']
},
xAxis: {
data: ['ann','bob','cand','done','elle']
},
yAxis: {},
series: [{
name: 'salary',
type: 'bar',
data: [2000, 3000, 4000, 5000, 3500]
}]
};
"
echartsExample(JScontent=JScodes)- 从R对象中绘图(ePlot)
library(recharts)
series = list(list(
  name = 'salary',
  type = 'bar',
  data = df$salary
))
ext = list(
  xAxis = list(list(
    data = df$name
  )),
  yAxis = list(list())
)
ePlot(series, ext)
将在viewer窗口中展示可交互的图表,如下图所示
!viewer窗口中展示的可交互的图表test5
利用周末学R语言-系列地址
利用周末学R语言 (1) - RStudio,helloworld,数据类型与获取数据
利用周末学R语言 (2) - 画图
利用周末学R语言 (3) - 数据处理
利用周末学R语言 (4) - 控制流,函数,面向对象
统计建模等更多内容见 github.com/nightttt7/Rweekends
- 因jupyter notebook格式更适合展示,新内容将只放在github上,旧内容不定时更新


