数据可视化实战——seaborn与matplotlib
关于数据可视化
我做过较多的探索,也写了一些学习笔记,方便自己复习与回顾
Python数据可视化之12种常用图表的绘制(一)——折线图/柱形图/条形图/散点图/气泡图/面积图
Python数据可视化之12种常用图表的绘制(二)——树地图&雷达图&箱型图&饼图&圆环图&热力图(附代码和效果图)
Python数据可视化之12种常用图表的绘制(三)——四种组合图表的绘制(附代码和效果图)
数据可视化实战——线条、颜色、背景、字体、标记、图例的设置与基本可视化图形的绘制
今天结合我的实战案例一起来学习一下seaborn与matplotlib
具体代码与源文件可以访问我的GitHub地址,欢迎star~
https://github.com/liuzuoping/MeachineLearning-Case
Python统计绘图:seaborn
# set style  darkgrid,whitegrid,dark,white,ticks
import matplotlib.pyplot as plt
import seaborn as sns
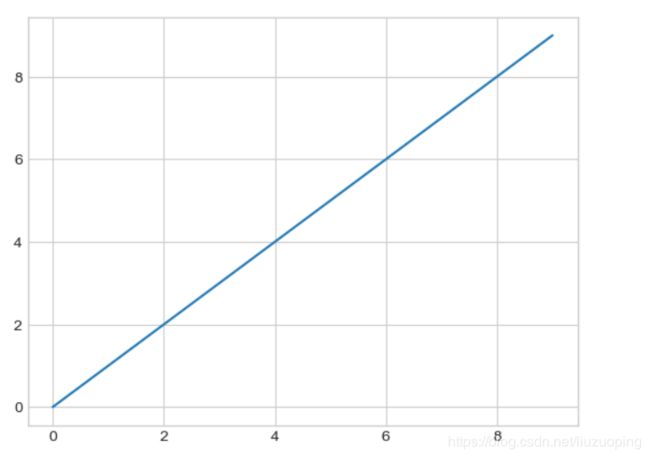
sns.set_style("whitegrid")
plt.plot(np.arange(10))
plt.show()
import pandas as pd

df_iris = pd.read_csv('./iris.csv')
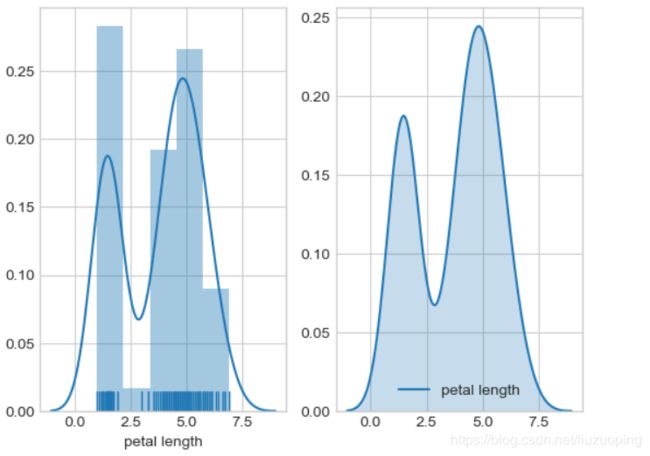
fig, axes = plt.subplots(1, 2)
sns.distplot(df_iris['petal length'], ax = axes[0], kde = True, rug = True)
sns.kdeplot(df_iris['petal length'], ax = axes[1], shade=True)
plt.show()
sns.set(palette="muted", color_codes=True)
rs = np.random.RandomState(10)
d = rs.normal(size=100)
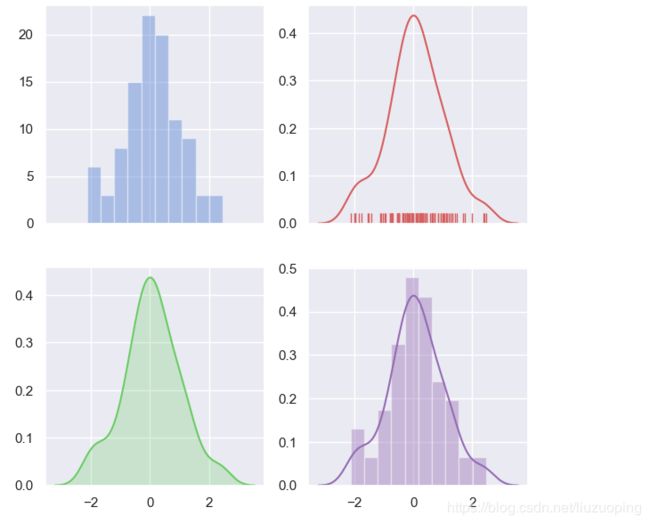
f, axes = plt.subplots(2, 2, figsize=(7, 7), sharex=True)
sns.distplot(d, kde=False, color="b", ax=axes[0, 0])
sns.distplot(d, hist=False, rug=True, color="r", ax=axes[0, 1])
sns.distplot(d, hist=False, color="g", kde_kws={"shade": True}, ax=axes[1, 0])
sns.distplot(d, color="m", ax=axes[1, 1])
plt.show()
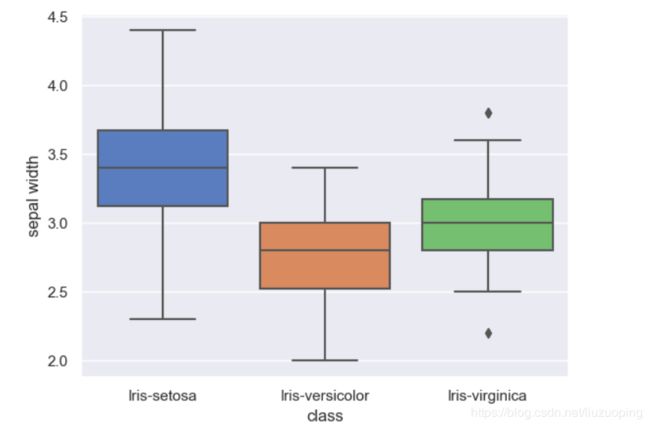
箱线图
sns.boxplot(x = df_iris['class'], y = df_iris['sepal width'])
图矩阵
sns.set()
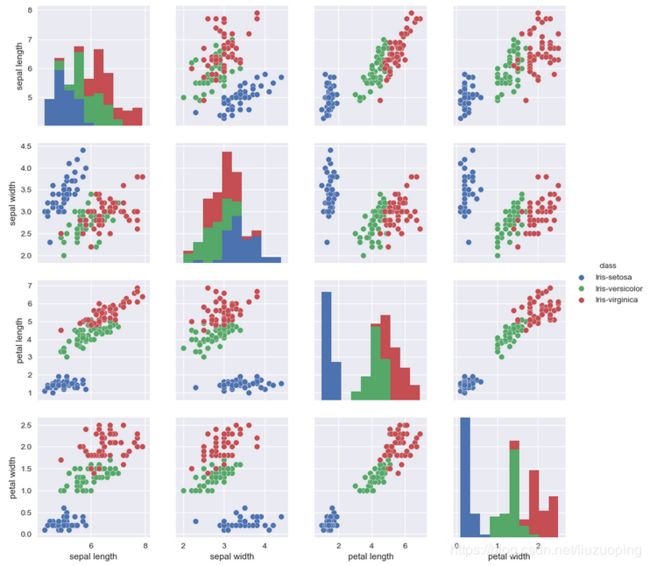
sns.pairplot(df_iris, hue="class")
plt.show()
参考文档:
- https://matplotlib.org/index.html
- http://seaborn.pydata.org/
实例:招聘数据的探索性数据分析
import pandas as pd
import numpy as np
import matplotlib.pyplot as plt
import seaborn as sns

data = pd.read_csv('./lagou_preprocessed.csv', encoding='gbk')
data.head()
数据基本信息
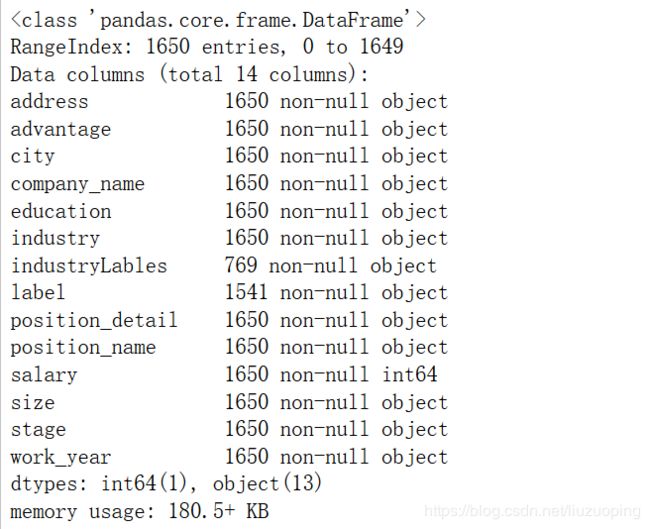
data.info()
数值型变量统计量描述
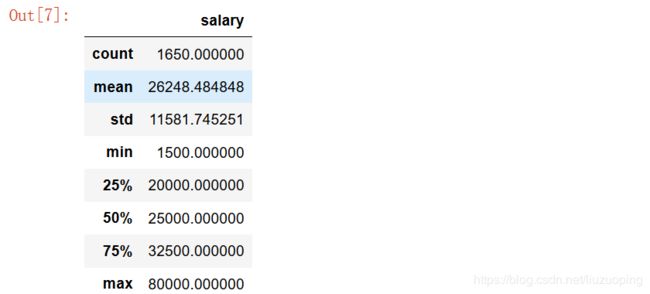
data.describe()
2.目标变量分析
# 目标变量统计量描述
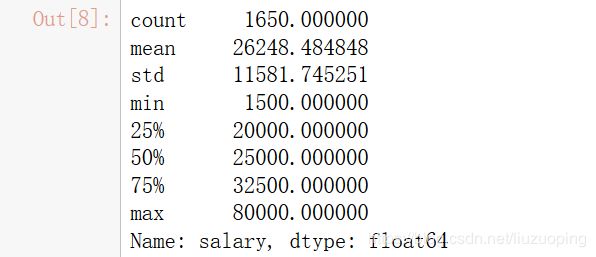
data['salary'].describe()
# 绘制目标变量的直方图,查看值分布
plt.hist(data['salary'])
plt.show()
# seaborn下的直方图
import warnings
warnings.filterwarnings('ignore')
sns.distplot(data['salary']);
# 计算目标变量值的偏度与峰度
from scipy import stats
# from scipy.stats import norm

print("Skewness: %f" % data['salary'].skew())
print("Kurtosis: %f" % data['salary'].kurt())
Skewness: 0.491585
Kurtosis: 0.948933
偏度小于1,峰度小于3,所以目标变量右偏且瘦尾
# 分类变量探索
# 分类值统计
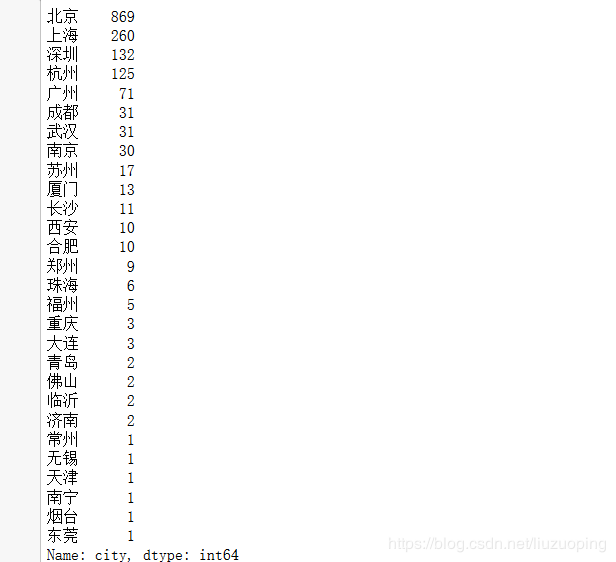
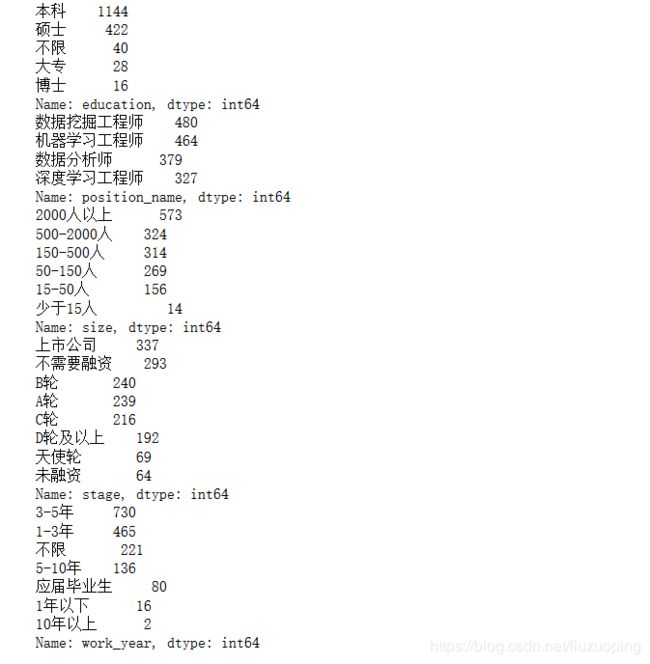
cols = ['city', 'education', 'position_name', 'size', 'stage', 'work_year']
for col in cols:
    print(data[col].value_counts())
# 处理city变量
# 将计数少于30的划为其他
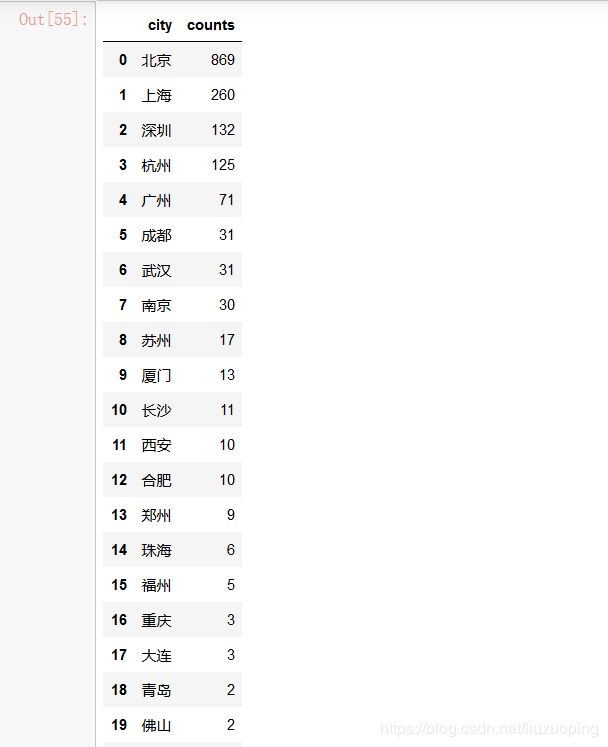
city_counts_df = pd.DataFrame()
city_counts_df['city'] = city_counts.index
city_counts_df['counts'] = data['city'].value_counts().values
city_counts_df
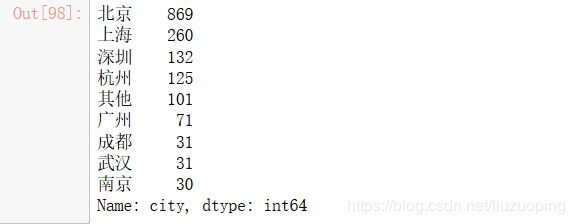
cities = ['北京', '上海', '广州', '深圳', '杭州', '成都', '武汉', '南京']
for i, j in enumerate(data['city']):
    if j not in cities:
        data['city'][i] = '其他'

data['city'].value_counts()
解决绘图中的中文字体显示问题
from pylab import *
mpl.rcParams['font.sans-serif'] = ['SimHei']
城市与工资水平
sns.boxplot(x = data['city'], y = data['salary']);
学历与工资水平
sns.boxplot(x = data['education'], y = data['salary']);
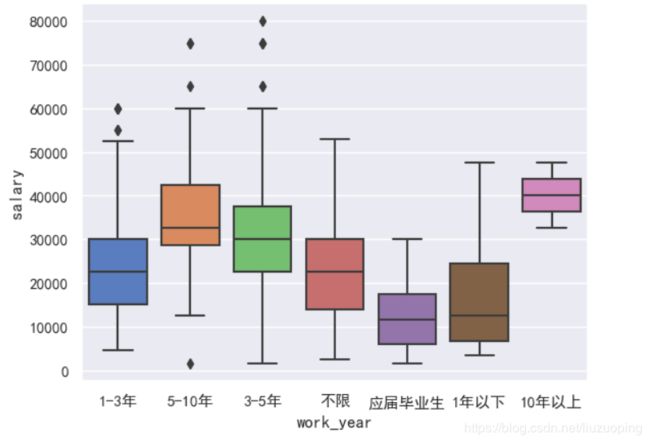
经验与工资水平
sns.boxplot(x = data['work_year'], y = data['salary']);
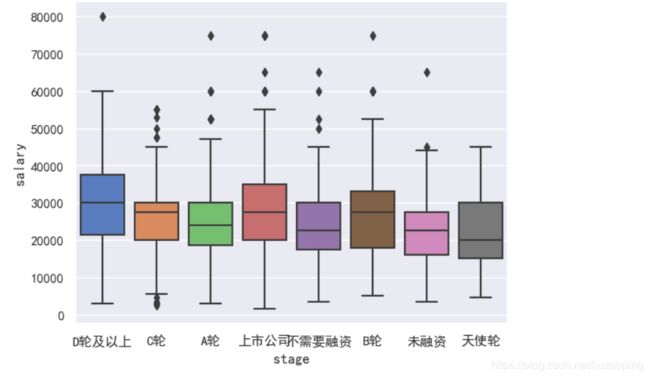
企业发展阶段与工资水平
sns.boxplot(x = data['stage'], y = data['salary']);
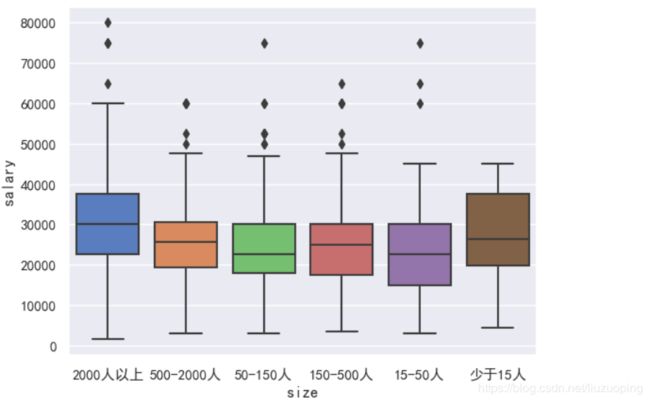
企业规模与工资水平
sns.boxplot(x = data['size'], y = data['salary']);
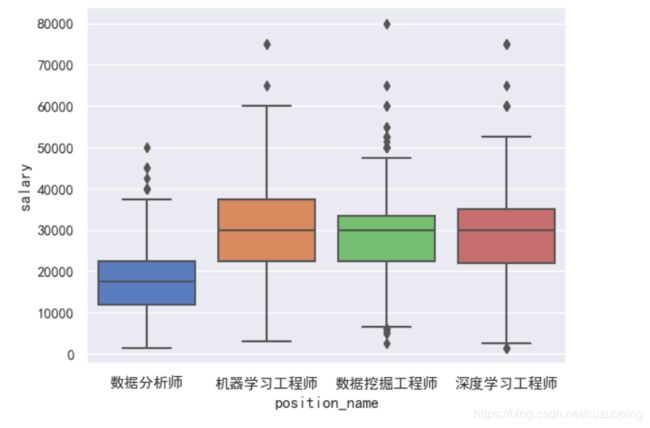
岗位与工资水平
sns.boxplot(x = data['position_name'], y = data['salary']);
处理industry变量
for i, j in enumerate(data['industry']):
    if ',' not in j:
        data['industry'][i] = j
    else:
        data['industry'][i] = j.split(',')[0]

data['industry'].value_counts()
industries = ['移动互联网', '金融', '数据服务', '电子商务', '企业服务', '医疗健康', 'O2O', '硬件', '信息安全', '教育']
for i, j in enumerate(data['industry']):
    if j not in industries:
        data['industry'][i] = '其他'

data['industry'].value_counts()
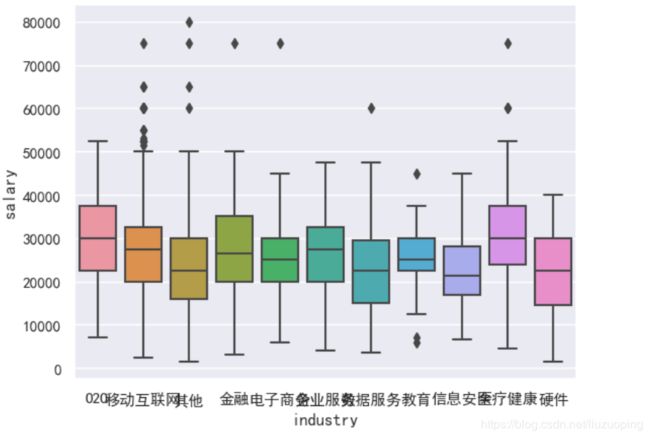
行业与工资水平
sns.boxplot(x = data['industry'], y = data['salary']);
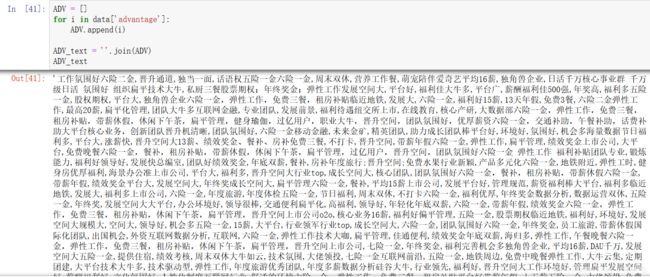
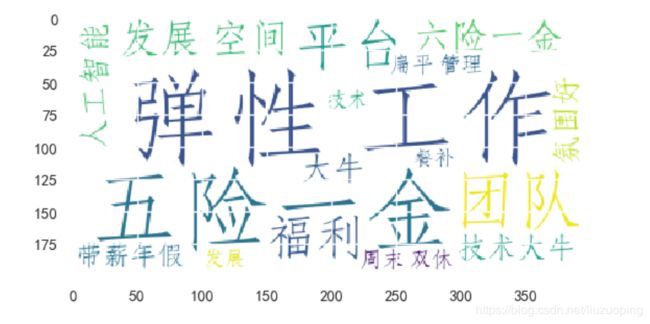
制作词云图
ADV = []
for i in data['advantage']:
    ADV.append(i)

ADV_text = ''.join(ADV)
ADV_text
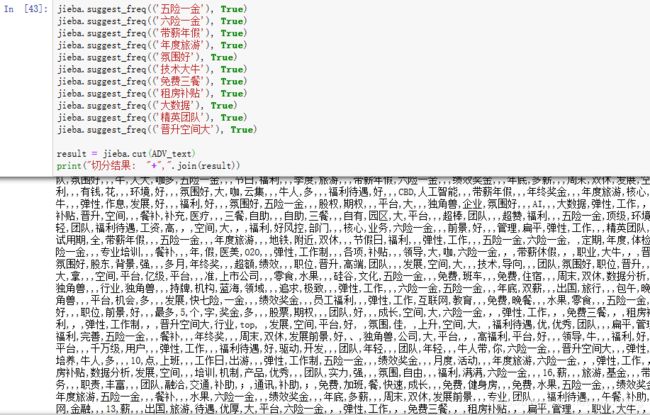
import jieba
result = jieba.cut(ADV_text)
print("切分结果:  "+",".join(result))
jieba.suggest_freq(('五险一金'), True)
jieba.suggest_freq(('六险一金'), True)
jieba.suggest_freq(('带薪年假'), True)
jieba.suggest_freq(('年度旅游'), True)
jieba.suggest_freq(('氛围好'), True)
jieba.suggest_freq(('技术大牛'), True)
jieba.suggest_freq(('免费三餐'), True)
jieba.suggest_freq(('租房补贴'), True)
jieba.suggest_freq(('大数据'), True)
jieba.suggest_freq(('精英团队'), True)
jieba.suggest_freq(('晋升空间大'), True)

result = jieba.cut(ADV_text)
print("切分结果:  "+",".join(result))
#读取标点符号库
f = open("./stopwords.txt", "r")
stopwords={}.fromkeys(f.read().split("\n"))
f.close()
#加载用户自定义词典
# jieba.load_userdict("./utils/jieba_user_dict.txt")
segs = jieba.cut(ADV_text)
mytext_list=[]
#文本清洗
for seg in segs:
    if seg not in stopwords and seg != " " and len(seg) != 1:
        mytext_list.append(seg.replace(" ", ""))

ADV_cloud_text = ",".join(mytext_list)
ADV_cloud_text
from wordcloud import WordCloud
wc = WordCloud(
    background_color="white", #背景颜色
    max_words=800, #显示最大词数
    font_path = r'C:\Windows\Fonts\STFANGSO.ttf',
    min_font_size=15,
    max_font_size=80
    )
wc.generate(ADV_cloud_text)
wc.to_file("1.jpg")
plt.imshow(wc)
plt.show()
剔除几个无用变量
data2 = data.drop(['address', 'industryLables', 'company_name'], axis=1)
data2.to_csv('./lagou_data5.csv')
data2.shape
(1650, 11)
