Python数据可视化——Seaborn笔记
写在前面:只记录本人在Kaggle数据可视化课程学习过程中,Seaborn模块的常用方法及部分效果图笔记,数据类型不作介绍和处理
课程链接Kaggle数据可视化课程
文章目录
- 导入模块
- 数据可视化
- 1. 曲线图lineplot
- 2. 条形图(barplot)
- 3.热图(heatmap)
- 4.散点图(scatterplot)
- 4.1 普通散点图
- 4.2 回归线散点图
- 4.3 多变量特征散点图
- 4.4 多变量特征回归线散点图(*注意此处坐标轴设置方式*)
- 4.5 不同特征变量对比散点图(方便对比关键特征变量)
- 5. 直方图
- 5.1 普通直方图
- 5.2 彩色直方图
- 6. 核密度估计图(kernel density estimate,KDE)
- 6.1 KDE
- 6.2 2D KDE
- 6.3 彩色KDE
导入模块
import pandas as pd
pd.plotting.register_matplotlib_converters()
import matplotlib.pyplot as plt
%matplotlib inline
import seaborn as sns
数据可视化
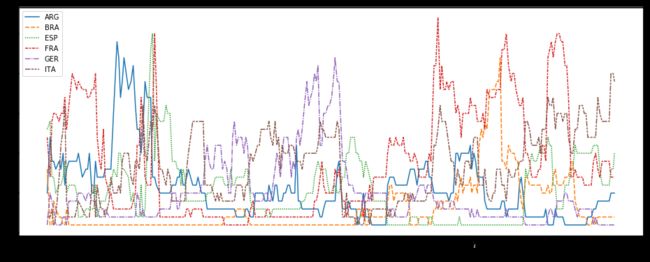
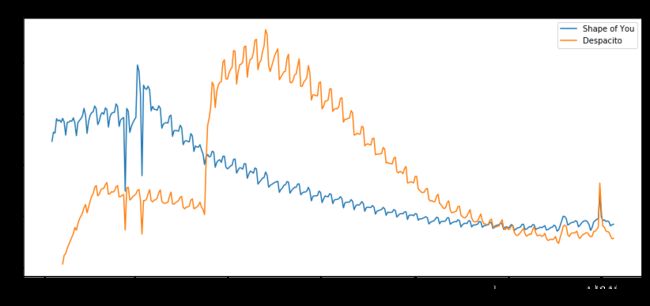
1. 曲线图lineplot
# Set the width and height of the figure
plt.figure(figsize=(16,6))
# 曲线图(此处示例数据为日期索引)
sns.lineplot(data=fifa_data)
sns.lineplot(data=spotify_data['Shape of You'], label="Shape of You")
sns.lineplot(data=spotify_data['Despacito'], label="Despacito")
plt.xlabel("Date")
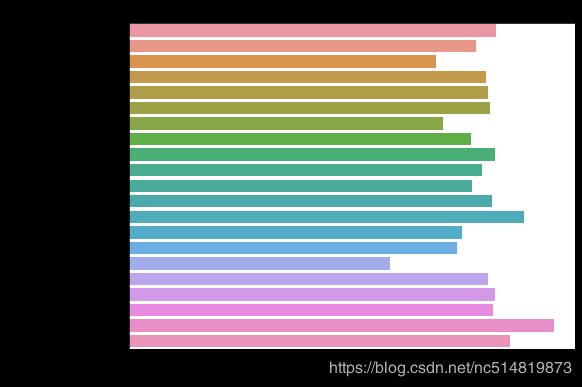
2. 条形图(barplot)
# Bar chart showing average score for racing games by platform
plt.figure(figsize=(8, 6))
sns.barplot(x=ign_data['Racing'], y=ign_data.index) # Your code here
# Add label for horizontal axis
plt.xlabel("Average Score")
# Add label for vertical axis
plt.title("Average Score for Racing Games, by Platform")
3.热图(heatmap)
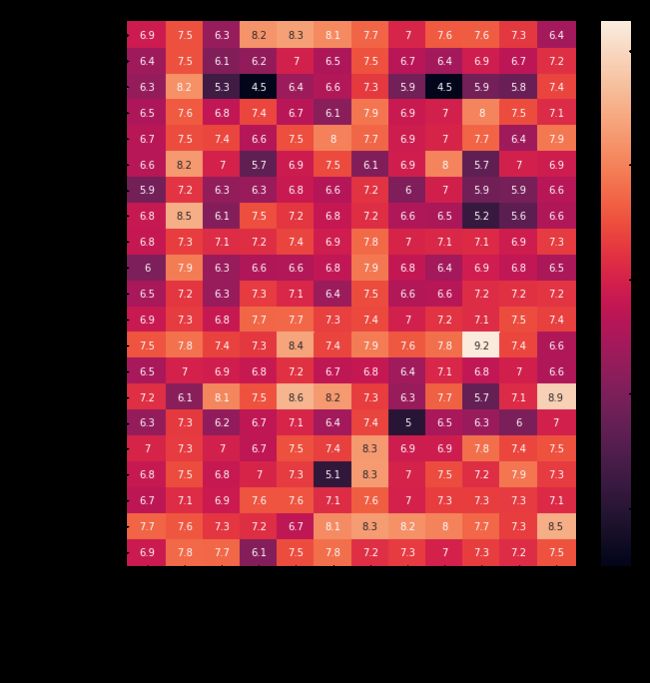
# Heatmap showing average game score by platform and genre
plt.figure(figsize=(10,10))
sns.heatmap(ign_data, annot=True)
#
# Add label for horizontal axis
plt.xlabel("Genre")
# Add label for vertical axis
plt.title("Average Game Score, by Platform and Genre")
annot=True- 加载数据集时,确保每个单元格的值都显示在图表上(忽略此操作将删除每个单元格中的数值)
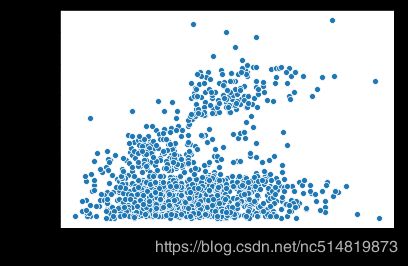
4.散点图(scatterplot)
4.1 普通散点图
sns.scatterplot(x=insurance_data['bmi'], y=insurance_data['charges'])
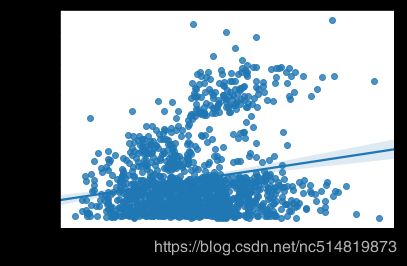
4.2 回归线散点图
sns.regplot(x=insurance_data['bmi'], y=insurance_data['charges'])
4.3 多变量特征散点图
sns.scatterplot(x=insurance_data['bmi'], y=insurance_data['charges'], hue=insurance_data['smoker'])
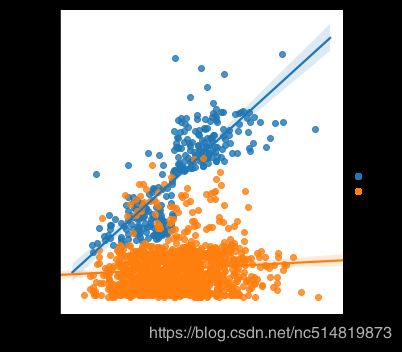
4.4 多变量特征回归线散点图(注意此处坐标轴设置方式)
sns.lmplot(x="bmi", y="charges", hue="smoker", data=insurance_data)
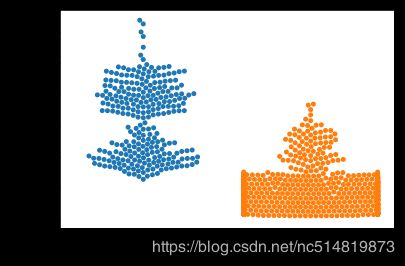
4.5 不同特征变量对比散点图(方便对比关键特征变量)
sns.swarmplot(x=insurance_data['smoker'],
              y=insurance_data['charges'])
5. 直方图
iris数据
5.1 普通直方图
# Histogram
sns.distplot(a=iris_data['Petal Length (cm)'], kde=False)

kde=False必须提供该参数,设置为True则会在直方图的基础上显示KDE曲线。
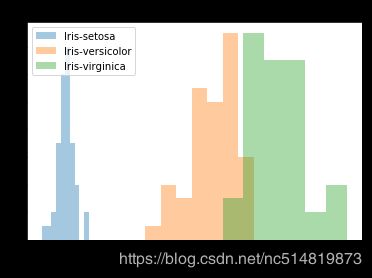
5.2 彩色直方图
使用不同颜色标识不同标签数据的直方图
# Histograms for each species
sns.distplot(a=iris_set_data['Petal Length (cm)'], label="Iris-setosa", kde=False)
sns.distplot(a=iris_ver_data['Petal Length (cm)'], label="Iris-versicolor", kde=False)
sns.distplot(a=iris_vir_data['Petal Length (cm)'], label="Iris-virginica", kde=False)

# Add title
plt.title("Histogram of Petal Lengths, by Species")

# Force legend to appear
plt.legend()
6. 核密度估计图(kernel density estimate,KDE)
6.1 KDE
# KDE plot
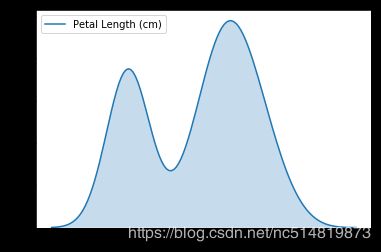
sns.kdeplot(data=iris_data['Petal Length (cm)'], shade=True)
# shade=True 表示将曲线下方区域用颜色标记
6.2 2D KDE
# 2D KDE plot
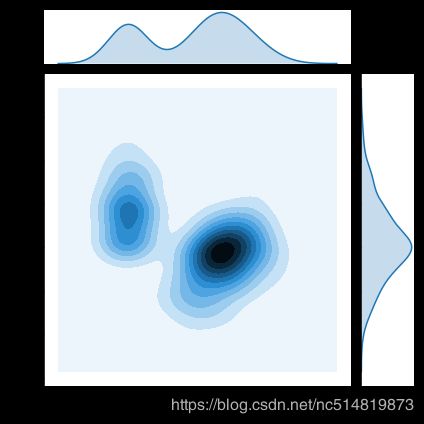
sns.jointplot(x=iris_data['Petal Length (cm)'], y=iris_data['Sepal Width (cm)'], kind="kde")
6.3 彩色KDE
使用不同颜色标识不同标签数据
# KDE plots for each species
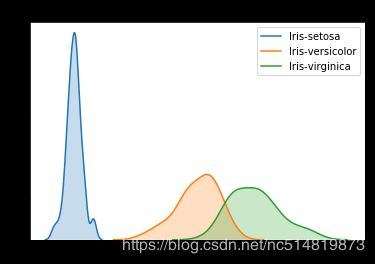
sns.kdeplot(data=iris_set_data['Petal Length (cm)'], label="Iris-setosa", shade=True)
sns.kdeplot(data=iris_ver_data['Petal Length (cm)'], label="Iris-versicolor", shade=True)
sns.kdeplot(data=iris_vir_data['Petal Length (cm)'], label="Iris-virginica", shade=True)

# Add title
plt.title("Distribution of Petal Lengths, by Species")
持续更新中~(2020-5-8)
