动手学习深度学习——目标检测指标mAP原理及举例
mAP原理及举例
- 1). mAP相关概念
- 2). 以图像检索mAP为例
- 3). 目标检测中的mAP案例
- 4). 总结
- 5). 代码实现
文中如有错误,或您有不同的看法,请评论中指出讨论,谢谢。
概念:
得到检测算法的预测结果后,需要对pred bbox与gt bbox一起评估检测算法的性能,涉及到的评估指标为mAP,那么当一个pred bbox与gt bbox的重合度较高(如IoU score > 0.5),且分类结果也正确时,就可以认为是该pred bbox预测正确,这里也同样涉及到IoU的概念;
1). mAP相关概念
- mAP: mean Average Precision, 即各类别AP的平均值
- AP: PR曲线下面积,后文会详细讲解
- PR曲线: Precision-Recall曲线
- Precision(查准率): TP / (TP + FP)
- Recall(召回率): TP / (TP + FN)
- TP: IoU>0.5的检测框数量(同一Ground Truth只计算一次)
- FP: IoU<=0.5的检测框,或者是检测到同一个GT的多余检测框的数量
- FN: 没有检测到的GT的数量
不管是Pascal VOC,还是COCO,甚至是人脸检测的wider face数据集,都使用到了AP、mAP的评估方式,那么AP、mAP到底是什么?如何计算的?
2). 以图像检索mAP为例
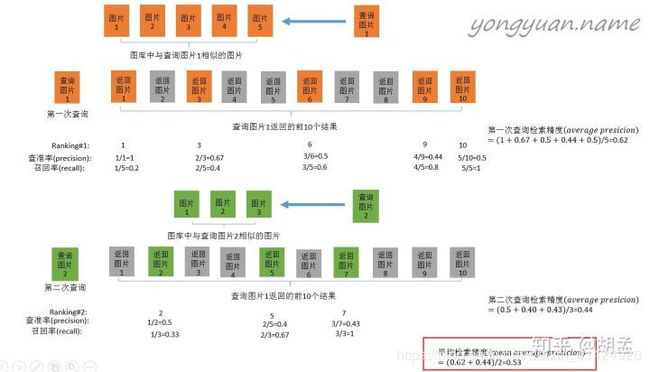
图像检索的案例取自:https://zhuanlan.zhihu.com/p/48992451
那么mAP到底是什么东西,如何计算?我们先以图像检索中的mAP为例说明,其实目标检测中mAP与之几乎一样:
案例背景:目的是为了检验图片检索的算法。
假设我们要从图库里查找和查询图片1类似的图片,而图库里实际存在图片1图片5五张图片是真正与查询图片1相似的。然后调用图片检索算法,设置算法找出的相似度排名前10的图片为最终结果,且计算出的相似度按顺序从大到小依次为返回图片1返回图片10。然后按图中顺序,每当召回率变化的时候计算一次recall和precision。最后把precision进行平均,即可得到检索算法对于查询图片1的 A P 1 AP_1 AP1。
换一张查询图片2,重复上述过程,可以计算得到查询图片2的 A P 2 AP_2 AP2。
那么此时图片检索算法的 m A P = ( A P 1 + A P 2 ) / 2 mAP=(AP_1+AP_2)/2 mAP=(AP1+AP2)/2。
3). 目标检测中的mAP案例
举例到此为止,那么mAP在目标检测中又是什么情况呢?其实和上述过程类似,上述过程的目的改成“为了检验目标检测算法”,而每次的查询图片1和2就相当于目标检测中的多个类别。图库中已知和查询图片相似的图片其实就是目标检测样本的ground truth。图片检索算法得到的10个检索结果就相当于目标检测中某个类别筛选出的bbox,相似度就相当于置信度(score)。既然对mAP在目标检测中的应用有了大致的概念,接下来直接举个例子加深印象。
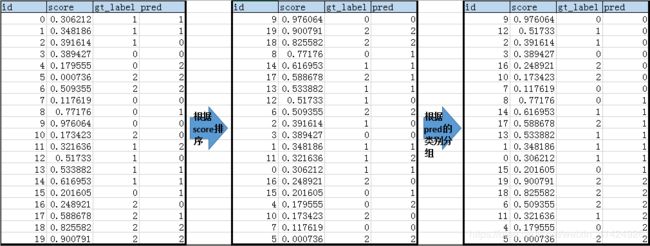
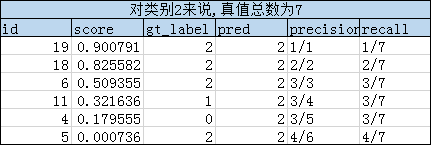
假设上图最左边是我们目标检测算法(通常是NMS之后)得到的20个bbox的最原始数据,每个bbox的置信度为score,对应IoU最大的ground truth bbox是gt_label,而预测的类别是pred。
然后我们按pred预测的类别进行分组,并在每个组内按置信度score进行排序。从而得到上图最右侧的数据表。
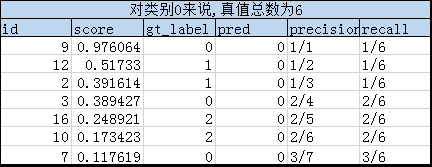
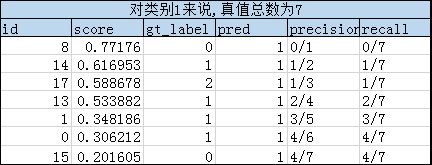
然后根据分组,对每个类别的组,按score从大到小的顺序依次对比gt_label和pred,从而得到TP(真阳)、FP(假阳)和FN(假阴)样本的数量,并依次计算一一对应的precision和recall数组。具体过程见下面三个表格:
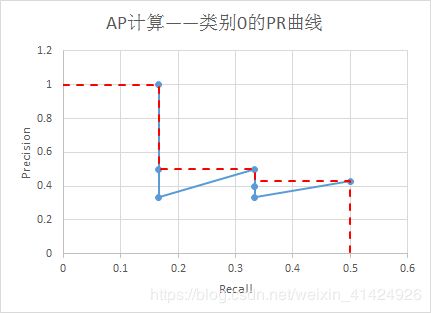
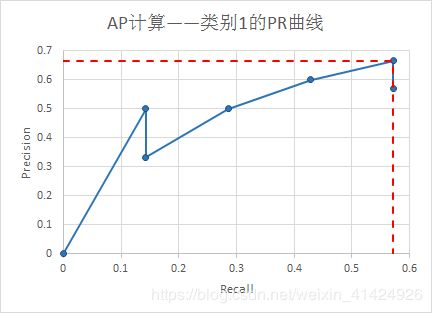
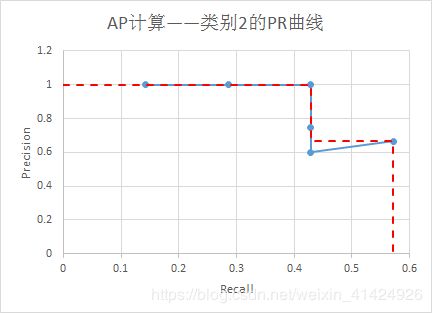
理论上,根据precision及其对应的recall数组,可以绘制出Precision-Recall曲线图(如下三个曲线图),然后根据曲线图计算每个类别的AP(即图中红虚线围成的面积,这个是VOC2010版本的计算方法)。注意,在recall=x时,precision的数值是 r e c a l l ∈ [ x , 1 ] recall \in [x, 1] recall∈[x,1]范围内的最大precision。
由此,可以计算出 A P 0 = 0.32 , A P 1 = 0.38 , A P 2 = 0.52 AP_0=0.32,AP_1=0.38,AP_2=0.52 AP0=0.32,AP1=0.38,AP2=0.52。所以有:
m A P = 1 C ∑ i = 0 C A P i = 0.4067 mAP=\frac{1}{C}\sum_{i=0}^CAP_i=0.4067 mAP=C1i=0∑CAPi=0.4067
4). 总结
所以,目标检测中计算mAP的步骤总结如下,适用于VOC2010版本,当然,VOC2007版本也差不多,就是计算AP的方法略有不同而已。
- 将目标检测算法预测出的每张图片的所有bbox数据经过NMS过滤后,整理成一个上图中最左侧的原始数据表;
- 将所有bbox根据置信度score进行降序排序,并按算法预测的类别pred将所有bbox进行分组,注意,每组内也是按score降序排序;
- 在每个分组内,分别计算precision和recall的数组,理论上可以得到PR曲线,但实际算法实现的时候并不需要。根据precision和recall数组计算每个类别的 A P i AP_i APi;
- 最后根据公式计算所有类别的mAP:
m A P = 1 C ∑ i = 0 C A P i = 0.4067 mAP=\frac{1}{C}\sum_{i=0}^CAP_i=0.4067 mAP=C1i=0∑CAPi=0.4067
理论步骤是上面那样,实际代码实现也差不多,但是有些步骤代码实现的很简洁,可以学习一下。
5). 代码实现
import numpy as np

def ap_per_class(tp, conf, pred_cls, target_cls):
    """
    计算所有类别的ap,precision,recall和f1指标。如果需要计算mAP,可以直接对ap取均值。
    代码来源:https://github.com/rafaelpadilla/Object-Detection-Metrics.
    :param tp: ndarray(1D), 元素类型为bool或0/1, tp[i]=true表示第i个bbox是真阳,也就是预测类别和真实类别相同。
    :param conf: ndarray(1D), 元素类型是float,取值范围为(0,1), 每个bbox的置信度。
    :param pred_cls: ndarray(1D), 对应每个bbox预测类别的标号, 取值范围为0,1,2,...,C-1
    :param target_cls: ndarray(1D), 对应与每个bbox的IoU最大的gt_bbox代表的类别标号, 取值范围为0,1,2,...,C-1
    :return: precision: 每个类别的查准率,
    recall: 每个类别的召回率,
    AP: 每个类别的AP,
    F1: 每个类别的F1指标,
    unique_classes.astype('int32'): 所有计算出AP的类别
    """
    # Sort by objectness  将所有数据根据置信度进行排序
    i = np.argsort(-conf)  # 加负号是为了降序排列
    tp, conf, pred_cls = tp[i], conf[i], pred_cls[i]

    # Find unique classes  找出所有不重复的目标类别
    unique_classes = np.unique(target_cls)

    # Create Precision-Recall curve and compute AP for each class
    # 计算每个类别的Precision-Recall曲线的数据,并以此计算每个类别的AP
    AP, precision, recall = [], [], []
    for c in unique_classes:
        i = pred_cls == c  # 掩模,用来排除所有预测出来不是c类的bbox
        n_gt = (target_cls == c).sum()  # Number of ground truth objects  第c类真实标签的数量
        n_p = i.sum()  # Number of predicted objects  预测为c类的bbox数量

        if n_p == 0 and n_gt == 0:
            continue
        elif n_p == 0 or n_gt == 0:
            AP.append(0)
            recall.append(0)
            precision.append(0)
        else:
            # Accumulate FPs and TPs  计算TP和FP的累加数组,方便计算Precision-Recall曲线的数据
            FPc = (1 - tp[i]).cumsum()
            TPc = (tp[i]).cumsum()

            # Recall = TP/n_GT
            recall_curve = TPc / (n_gt + 1e-16)
            recall.append(recall_curve[-1])  # 将每个类别组的召回率保存起来

            # Precision = TP/(TP+FP)
            precision_curve = TPc / (TPc + FPc)
            precision.append(precision_curve[-1])  # 将每个类别组的查准率保存起来

            # AP from recall-precision curve  利用Precision-Recall曲线的数据计算该类的AP
            AP.append(compute_ap(recall_curve, precision_curve))

            # Plot  绘制PR曲线图(如有需要)
            # plt.plot(recall_curve, precision_curve)

    # Compute F1 score (harmonic mean of precision and recall)
    precision, recall, AP = np.array(precision), np.array(recall), np.array(AP)
    F1 = 2 * precision * recall / (precision + recall + 1e-16)

    return precision, recall, AP, F1, unique_classes.astype('int32')


def compute_ap(recall, precision):
    """
    计算Precision-Recall曲线的AP,VOC2010版
    代码来源:https://github.com/rbgirshick/py-faster-rcnn.
    :param recall: ndarray(1D),Precision-Recall曲线的recall数据
    :param precision: ndarray(1D),Precision-Recall曲线的precision数据
    :return: ndarray(1D),Precision-Recall曲线的AP,VOC2010版
    """
    # correct AP calculation
    # first append sentinel values at the end  给Precision-Recall曲线添加头尾
    mrec = np.concatenate(([0.], recall, [1.]))
    mpre = np.concatenate(([0.], precision, [0.]))

    # compute the precision envelope
    # 简单的应用了一下动态规划,实现在recall=x时,precision的数值是recall=[x, 1]范围内的最大precision
    for i in range(mpre.size - 1, 0, -1):
        mpre[i - 1] = np.maximum(mpre[i - 1], mpre[i])

    # to calculate area under PR curve, look for points where X axis (recall) changes value
    # 寻找recall[i]!=recall[i+1]的所有位置,即recall发生改变的位置,方便计算PR曲线下的面积,即AP
    i = np.where(mrec[1:] != mrec[:-1])[0]

    # and sum (\Delta recall) * prec
    # 用积分法求PR曲线下的面积,即AP
    ap = np.sum((mrec[i + 1] - mrec[i]) * mpre[i + 1])
    return ap

if __name__ == '__main__':
    # 一下测试数据与上文举例中的数据相同,用来验证上文计算mAP的思想
    tp = np.array([True, True, False, True, False,
          True, True, True, False, True,
          False, False, False, True, True,
          False, False, False, True, True,])
    conf = np.array([0.3062, 0.3482, 0.3916, 0.3894, 0.1796,
            0.0007, 0.5094, 0.1176, 0.7718, 0.9761,
            0.1734, 0.3216, 0.5173, 0.5339, 0.6169,
            0.2016, 0.2489, 0.5887, 0.8256, 0.9008])
    pred_cls = np.array([1, 1, 0, 0, 2, 2, 2, 0, 1, 0,
                0, 2, 0, 1, 1, 1, 0, 1, 2, 2])
    gt_cls = np.array([1, 1, 1, 0, 0, 2, 2, 0, 0, 0,
              2, 1, 1, 1, 1, 0, 2, 2, 2, 2,])
    ap_per_class(tp, conf, pred_cls, gt_cls)

      0, 2, 0, 1, 1, 1, 0, 1, 2, 2])
    gt_cls = np.array([1, 1, 1, 0, 0, 2, 2, 0, 0, 0,
              2, 1, 1, 1, 1, 0, 2, 2, 2, 2,])
    ap_per_class(tp, conf, pred_cls, gt_cls)
