How to Use FxCop
来自:http://blog.csdn.net/yefengmeander/article/details/6572647
As usual there are times when we love cops (when they rescue us from problems). However there are times when we hate say ohh god not cop again (when they catch us or fine).
Introduction
FxCop , an abbreviation "Framework Police," is a rules-based engine that checks managed code assemblies for Microsoft's .NET Framework design guidelines and custom guidelines. FxCop is a rule based engine which helps the development team to follow best practices of the .NET platform and development standards (based on every company standards).
You can apply to any assembly which been created using any language that target Microsoft.NET managed environment.
Answer
- Make sure coding standards are followed such as naming conventions, globalization etc. as per company standards.
- Avoid bad coding. (No one writes bad code, however as the application grows, development team size also grows usually so every new team member must know how to design their classes, follow naming convention, etc.).
- Predefined set of rules.
- Support for creating custom rules.
- Generate formatted XML Analysis Report.
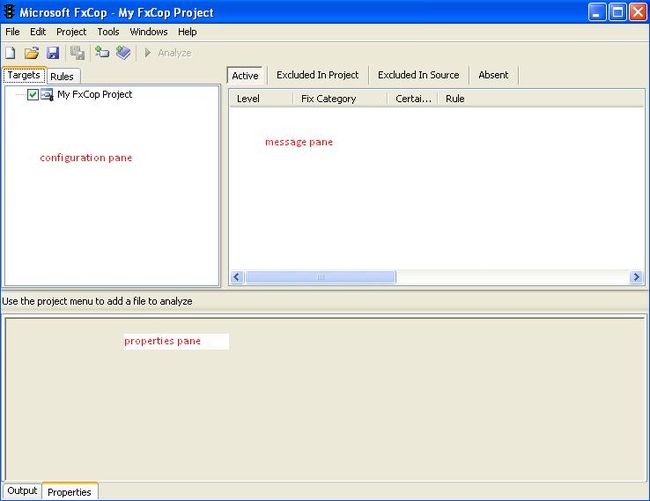
Once you install FxCop , Go to Start Menu -> All Programs -> "Microsoft FxCop " option and then click on FxCop . It will launch an empty window similar to the one shown below. It contains 3 panes – configuration pane, message pane and properties pane.
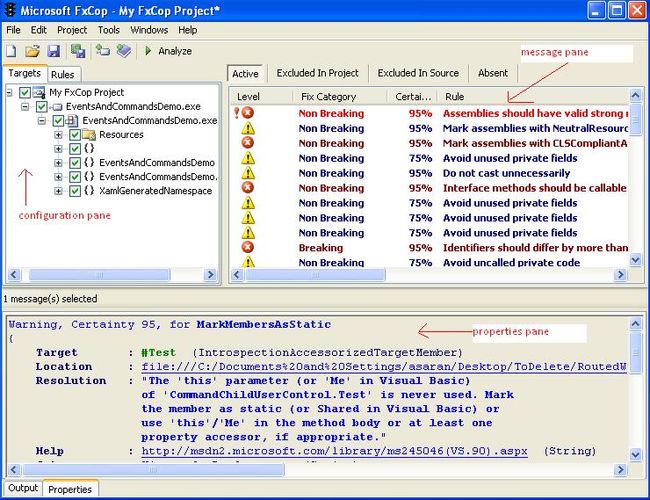
Go to Project Menu and click on “Add Targets…”. Select the EXE or DLL. Once it is done, click on Analyze button and your screen will look like below:
Configuration Pane
Targets TAB
To analyze and which rules to check load, assemblies/exe. There are 2 tabs at the top of pane (Targets and Rules). It can load more than one assembly into the project by clicking on "Add Target for Analysis" button in toolbar or through Menu "Project->Add Targets”. It shows you all the resources included in the assembly, all the namespaces in the assembly and for each namespace, all the types. Drilling deeper with the plus sign in front of each type, you can show all the members. It shows the constructors, methods, properties and fields.
Selecting a resource, assembly, type or member of a type shows the following information in the property pane:
- Resource – It lists all the resources and for string resources also displays the string itself.
- Namespace – Shows the name of the namespace and how many types it contains.
- Type – Lists a summary about the type which includes the base type, which namespace it is in, its visibility and many more things.
- Type member – Lists a summary about the type member which includes full name, return type, visibility and more.
Right clicking on a type member, you can select from the "View | IR" popup menu to show the IL code for this member.
Rules TAB
There are by default nine groups of rules:
- Design Rules – Rules about the design of your .NET types and assemblies
- Globalization Rules – Globalization/localization rules
- Interoperability Rules – Rules about COM interoperability
- Mobility Rules - Rules about periodic activity that keep the CPU busy
- Naming Rules – Rules about naming conventions
- Performance Rules – Rules to improve performance of your code
- Portability Rules - Rules about portability across different platforms
- Security Rules – Rules to make your code more secure
- Usage Rules – Rules about proper usage of the .NET Framework
Right click on the rules list displays a popup menu which helps to group the rules in three categories:
- File Name – By default grouping and show nine groups of rules
- Message Level – Groups the rules by the message level – Critical Error, Error, Critical Warning, Warning and Information. This group provides which rules generate which level of messages.
- Breaking Changes – Groups the rules into three groups – Breaking, Non Breaking and Unknown (Default). All rules provided by FxCop are categorized under Breaking or Non-Breaking.
Message Pane
Click on the Analyze button in the toolbar while doing so shows a progress bar, and then fills the message pane with all the messages it found. On top of the pane, you see three buttons – Active, Excluded and Absent.
The Active list shows you all the active messages. These are all the errors and warnings FxCop has found with the last analysis performed. By Default, display four columns in that list:
- Level – The message level assigns an importance to the message. The following levels are supported:
- Critical Error – Issues reported with this level have high visibility and the identified code does not operate correctly in most common scenarios. These issues should be resolved first. You should not exclude issues with this level.
- Error – Issues at this level have less visibility and impact. But it still identifies issues in your code you need to resolve. Also these issues should not be excluded without careful consideration.
- Critical Warning – This level is mostly used for maintainability issues of your code. The code is working correctly but less-than-optimal. Exclude such messages only after careful consideration.
- Warning – Messages with this level are identifying issues in your code around maintainability, extensibility and stability.
- Informational – Informational messages about the code.
- Certainty – Each message has a certainty in percent. A code analysis tool may sometimes not understand completely what you are trying to achieve with your code. So it may report a "false-positive", meaning the tool believes this to be an issue but after you reviewed it, you come to the conclusion that there is nothing wrong with the code. The code does what you intend it to do. Each rule calculates a certainty for each message it generates. This is a way for the rule to tell you how likely this is an issue. You should not exclude messages with a high certainty.
- Rule – The name of the rule which generated the message.
- Item – The target item, whether this is the assembly, type or a type member, which generated the message.
You can right click in the list and select "configure columns" from the popup menu. This allows you to show some additional columns like when was the issue seen first time (Created column), when was the issue seen last time (Last Seen column), is this a new issue (New column), etc.
Selecting a message shows you a summary in the properties pane. It includes the target item which caused the message, a short resolution description and also a help link which shows you a detailed description of the issue and the resolution for it. You can also double click on a message which brings up a dialog box with the same information but differently organized:
The "Message Details" dialog box has five tabs.
- Issues tab - shows you the target item which caused the message. Underneath it you see a list of all messages found for this target item. Clicking on a message in the list will show you in the resolution area below a short description of the resolution. FxCop will also show you a link to the source code if it finds a symbol file (file with the same name as the DLL but with a PDB extension) in the same location where the assembly is located.
- Rule Details tab - contains detailed information about the message itself. It shows the message, the message level, the certainty, the description and additional information which helps you to understand what you need to change in your code to resolve the issue.
- Message tab - shows you the assembly name which causes the message, when the message appeared the first time and last time plus a tree to the target item, e.g. the method which caused the message.
- Rule Support tab - shows you more information about the rule itself. This includes the name of the rule, the URL to the help page associated with the rule, the author of the rule with an email address to contact and information about the assembly which contains the rule.
- Notes tab - contains a list of notes you can add to the message. You can add new notes by clicking on the add button, edit existing notes by double clicking on it or remove notes by selecting it and clicking on the remove button. This becomes very useful when you have excluded or resolved a message and you want to go back and find out what you have changed.
You can also filter the messages by clicking on a group of rules, an individual rule or an assembly, namespace, type or type member. Selecting the top node in the Targets or Rule tab shows again all messages. For example, selecting a type allows you to work through all messages of that type. Another example is if you are working on a certain type member, selecting it allows you to view and work through all the messages of this type member. Or maybe you just resolved a certain issue and you want to see any other occurrence of it. So you click on the specific rule which created the message and it allows you to view and work through any other occurrence of that message.
You need to work through all messages one-by-one. A message can describe an issue in your code which needs to be resolved or you determine after careful review that it is a false-positive. If it is a false-positive meaning FxCop believes it to be an issue but you determined after careful review that this is not an issue then you mark it as excluded. You right click on the message and select Exclude from the popup menu. This can also be done by double clicking on the message and clicking on the Exclude button in the "Message Details" dialog. In the upcoming "Edit Notes" dialog box, you enter a summary why it is a false-positive and then click Ok. This moves the message from the Active list to the Excluded list. FxCop will exclude this message from now on every time you perform another analysis. Clicking on the Excluded button on top of the message pane will show you all the excluded messages. Double clicking on the message shows you again the "Message Details" dialog and the Notes tab allows you to view the notes you entered when marking the message as excluded. You can move a message back to the active list by right clicking on it and selecting "Mark as Active" from the popup menu. You can also do this by double clicking on the message and selecting the Unexclude button on the "Message Details" dialog.
You have two ways to remove a message from the Active list after you have resolved the issue. You can right click on the message and select "Mark as Absent" from the popup menu or you just run another analysis and FxCop detects that the issue has been resolved and moves it to the Absent list for you. Don't forget to recompile your code as FxCop doesn't look at the source code but rather the compiled assembly. I consider it good practice to add some notes to the message after it has been moved to the Absent list. This provides a historical view and allows to go back and understand why you have made certain changes. Clicking on the Absent button on top of the message pane shows you all the resolved issues.
Saving your FxCop project only saves active and excluded messages but not the Absent ones. So if you want to keep a historical view go to menu "Project | Options" and on the "Project Options" dialog, on the Standard tab, select the Absent checkbox in the "Save Messages" group. This changes the option only for the current project. Going to "Tools | Settings" menu shows the Settings dialog. On the "Project defaults" tab, select the Absent checkbox under the "Save Messages" group. This setting takes then effect for all future FxCop projects you create. I recommend keeping the historical view because I always find it useful to be able to go back and understand what has been changed on a project over time, especially if you suddenly run into un-explainable exceptions, crashes or other difficulties with your product.
Properties Pane
This pane has two tabs. The properties tab shows information about the selected assembly, namespace, type, type member, group of rules, rule or message. We have covered that already in detail. The Output tab shows informational, warning and error messages generated by the rules. These messages only appear if the TraceGeneral trace-switch in the FxCop .exe .config file is enabled.
Reporting Features
Click on the menu "File | Save Report As" and provide a name and location for the report. The report is stored as an XML document which references a XSLT document - FxCop Report.xsl . Opening the report with your browser uses the referenced XSLT document to render a HTML report. The report allows you to drill down to all messages on the assembly level, type level and type member level.
The report, by default, only includes active messages. So, if you want to keep a historical view, go to menu "Project | Options" and on the "Project Options" dialog, on the Standard tab, select the Excluded and Absent checkbox in the "Save Messages" group (for reporting). This changes the option only for the current project. Going to "Tools | Settings" menu shows the Settings dialog. On the "Project defaults" tab, select the Excluded and Absent checkbox under the "Save Messages" group (for reporting). This setting then takes effect for all future FxCop projects you create. Try to include the historical view in the generated reports because it is useful to be able to go back and understand what has been changed on a project over time.
Visual Studio Integration of FxCop
To set up FxCop as an external tool in Visual Studio:
- On the Tools menu, click External Tools, and then click Add.
- Enter the following information in External Tools dialog box:
- Title: FxCop
- Command: C:/Program Files/Microsoft FxCop 1.36/FxCop Cmd.exe
- Arguments: /c /f:$(TargetPath) /d:$(BinDir) /r:"c:/Program Files/Microsoft FxCop 1.36/Rules"
- Initial directory: C:/Program Files/Microsoft FxCop 1.36
Note : If you had created custom rules and want to apply to all projects, place the custom rule DLL to c:/Program Files/Microsoft FxCop 1.36/Rules .
The External Tools configuration dialog box is displayed. The following screen shot shows the dialog box after the steps in this procedure have been completed.
Done. Now you just need to run FxCop .
Go to Tools –> FxCop analyze your code and because we checked “Use Output window” in External Tools dialog, result should appear in Visual Studio output window.
- Works with any managed assembly created in .NET language that run on Microsoft .NET Framework.
- It cannot automatically fix errors if it finds.
- Currently supports only one type of report. No support for custom type report.
FxCop
- It runs on compiled DLLs.
- As it runs on compiled IL code, it can be used for C#, VB.NET, in short any language which compiles to IL code.
StyleCop
- Keep in mind that it is not a Microsoft product. It is not even a Team System Power Tool. It is a tool developed by a very passionate developer at Microsoft (on evenings and weekends). There's no support, servicing, evolution or anything else beyond what he can get done in his spare time. Style checking is an interesting feature and may show up in an official product at some point down the road.
- It runs on actual source code.
- Currently it runs only on C#.
- The ultimate goal of StyleCop is to allow to produce elegant, consistent code that team members and others who view developer code will find highly readable.
Code Analysis
- No spell checking - FxCop uses a dictionary (plus custom dictionary) to check the names of methods, classes, etc. Code Analysis doesn't seem to do that.
- Help - FxCop not only complained when something was wrong but provided a great deal of help/hints to resolve the problem. Code Analysis just seems to present the problem with no sign of a hint.
- Note that Code Analysis is only available in the Premium and Ultimate editions of Visual Studio 2010 and also Visual Studio 2005 & 2008 Team System.
Area Not Covered for FxCop
- Webservices/WCF
- Validate XML Document
Further Reading
- Bad Code? FxCop to the Rescue
- Three Vital FXCop Rules
- Visual Studio Integration of FxCop
- Running FxCop rules against Silverlight or WPF XAML


