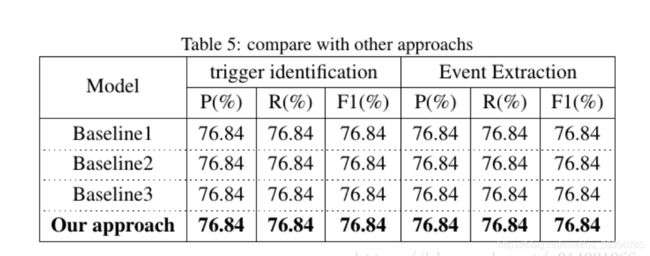
关键要记得导入一下三个包哦:
\usepackage{multirow}
\usepackage{multicol}
\usepackage{arydshln}
\begin{table*}[tp]
\centering
\caption{compare with other approachs}
\label{tab:methodcompare}
\begin{tabular}{|c|c|c|c|c|c|c|}
\hline
\multirow{2}*{Model} & \multicolumn{3}{c|}{trigger identification} &  \multicolumn{3}{c|}{Event Extraction} \\
\cline{2-7}
        & P(\%) & R(\%) & F1(\%) & P(\%) & R(\%) & F1(\%) \\
\hline
Baseline1 & 76.84 & 76.84 & 76.84 & 76.84 & 76.84 & 76.84 \\
\cdashline{1-7}[0.8pt/2pt]
Baseline2  & 76.84 & 76.84 & 76.84 & 76.84 & 76.84 & 76.84 \\
\cdashline{1-7}[0.8pt/2pt]
Baseline3  & 76.84 & 76.84 & 76.84 & 76.84 & 76.84 & 76.84 \\
\cdashline{1-7}[0.8pt/2pt]
{\bf Our approach}  & {\bf 76.84} & {\bf 76.84} & {\bf 76.84} & {\bf 76.84} & {\bf 76.84} & {\bf 76.84} \\
\hline

三线表法
\usepackage{booktabs}
\usepackage{threeparttable}

\renewcommand{\arraystretch}{1.5} %控制行高
\begin{table}[tp]

  \centering
  \fontsize{6.5}{8}\selectfont %设置成较为合适的的比例,防止超过边界
  \begin{threeparttable}
  \caption{Demographic Prediction performance comparison by three evaluation metrics.}
  \label{tab:performance_comparison}
    \begin{tabular}{ccccccc}
    \toprule
    \multirow{2}{*}{Method}&
    \multicolumn{3}{c}{ G}&\multicolumn{3}{c}{ G}\cr
    \cmidrule(lr){2-4} \cmidrule(lr){5-7}
    &Precision&Recall&F1-Measure&Precision&Recall&F1-Measure\cr
    \midrule
    kNN&0.7324&0.7388&0.7301&0.6371&0.6462&0.6568\cr
    F&0.7321&0.7385&0.7323&0.6363&0.6462&0.6559\cr
    E&0.7321&0.7222&0.7311&0.6243&0.6227&0.6570\cr
    D&0.7654&0.7716&0.7699&0.6695&0.6684&0.6642\cr
    C&0.7435&0.7317&0.7343&0.6386&0.6488&0.6435\cr
    B&0.7667&0.7644&0.7646&0.6609&0.6687&0.6574\cr
    A&{\bf 0.8189}&{\bf 0.8139}&{\bf 0.8146}&{\bf 0.6971}&{\bf 0.6904}&{\bf 0.6935}\cr
    \bottomrule
    \end{tabular}
    \end{threeparttable}
\end{table}


