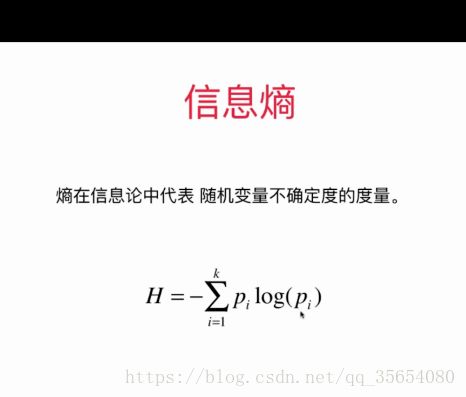
机器学习之决策树
"""决策树"""
import numpy as np
import matplotlib.pyplot as plt
from sklearn import datasets
from sklearn.tree import DecisionTreeClassifier

iris=datasets.load_iris()
X=iris.data[:,2:]
y=iris.target

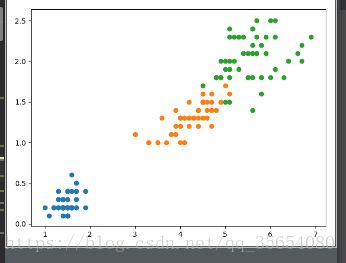
plt.scatter(X[y==0,0],X[y==0,1])
plt.scatter(X[y==1,0],X[y==1,1])
plt.scatter(X[y==2,0],X[y==2,1])
plt.show()

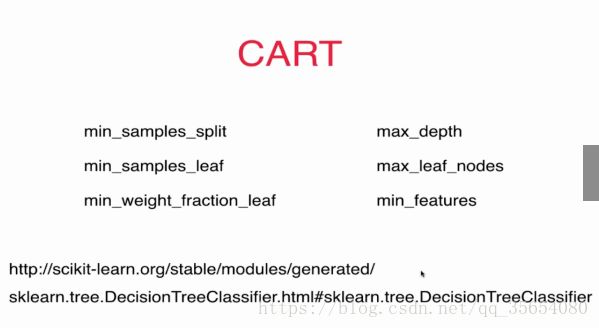
dt_clf=DecisionTreeClassifier(max_depth=2,criterion='entropy')
dt_clf.fit(X,y)

def plot_decision_boundary(model,axis):
    x0,x1 = np.meshgrid(
        np.linspace(axis[0],axis[1],int((axis[1]-axis[0])*100)),
        np.linspace(axis[2],axis[3],int((axis[3]-axis[2])*100))
    )
    X_new = np.c_[x0.ravel(),x1.ravel()]
    y_predict = model.predict(X_new)
    zz = y_predict.reshape(x0.shape)
    from matplotlib.colors import ListedColormap
    custom_cmap = ListedColormap(['#EF9A9A','#FFF59D','#90CAF9'])
    plt.contourf(x0,x1,zz,linewidth=5,cmap=custom_cmap)
plot_decision_boundary(dt_clf,axis=[0.5,7.5,-1.0,3])
plt.scatter(X[y==0,0],X[y==0,1])
plt.scatter(X[y==1,0],X[y==1,1])
plt.scatter(X[y==2,0],X[y==2,1])
plt.show()
"""模拟使用信息熵进行划分"""
def split(X,y,d,value):
    index_a=(X[:,d]<=value)
    index_b=(X[:,d]>value)
    return X[index_a],X[index_b],y[index_a],y[index_b]

from math import log
from collections import Counter
def entropy(y):
    counter=Counter(y)
    res=0.0
    for num in counter.values():
        p=num/len(y)
        res+=-p*log(p)
    return res

def try_split(X,y):
    best_entropy=float('inf')
    best_d,best_v=-1,-1
    for d in range(X.shape[1]):
        sorted_index=np.argsort(X[:,d])
        for i in range(1,len(X)):
            if X[sorted_index[i-1],d]!=X[sorted_index[i],d]:
                v=(X[sorted_index[i-1],d]+X[sorted_index[i],d])/2
                X_l,X_r,y_l,y_r=split(X,y,d,v)
                e=entropy(y_l)+entropy(y_r)
                if e
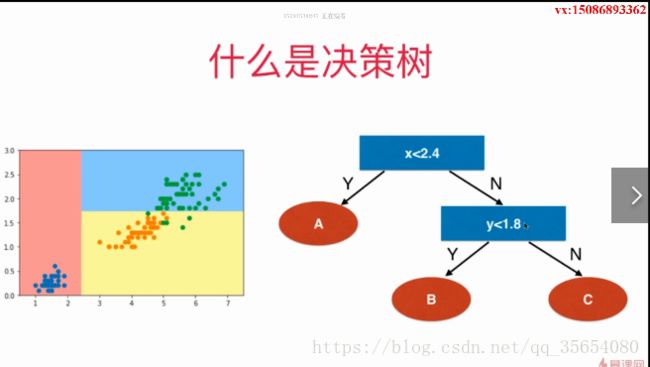
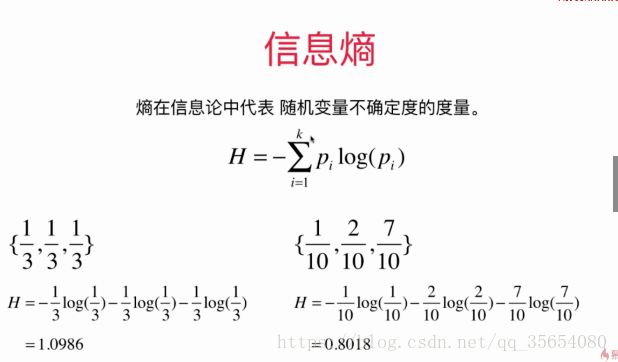
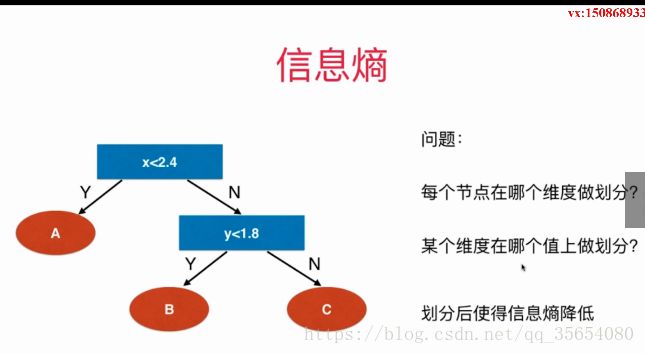
参照上图:最好的维度是第0维,左边信息熵最小为0,右边信息熵为0.69,说明右面可以继续划分。
第二次划分,最好的维度是第一维,左边信息熵是0.30,右面的信息熵为0.1。
使用基尼系数
"""基尼系数"""
import numpy as np
import matplotlib.pyplot as plt
from sklearn import datasets
from sklearn.tree import DecisionTreeClassifier

iris=datasets.load_iris()
X=iris.data[:,2:]
y=iris.target

dt_clf=DecisionTreeClassifier(max_depth=2,criterion='gini')
dt_clf.fit(X,y)

def plot_decision_boundary(model,axis):
    x0,x1 = np.meshgrid(
        np.linspace(axis[0],axis[1],int((axis[1]-axis[0])*100)),
        np.linspace(axis[2],axis[3],int((axis[3]-axis[2])*100))
    )
    X_new = np.c_[x0.ravel(),x1.ravel()]
    y_predict = model.predict(X_new)
    zz = y_predict.reshape(x0.shape)
    from matplotlib.colors import ListedColormap
    custom_cmap = ListedColormap(['#EF9A9A','#FFF59D','#90CAF9'])
    plt.contourf(x0,x1,zz,linewidth=5,cmap=custom_cmap)
plot_decision_boundary(dt_clf,axis=[0.5,7.5,-1.0,3])
plt.scatter(X[y==0,0],X[y==0,1])
plt.scatter(X[y==1,0],X[y==1,1])
plt.scatter(X[y==2,0],X[y==2,1])
plt.show()

"""模拟使用基尼系数进行划分"""
def split(X,y,d,value):
    index_a=(X[:,d]<=value)
    index_b=(X[:,d]>value)
    return X[index_a],X[index_b],y[index_a],y[index_b]

from math import log
from collections import Counter
def jini(y):
    counter=Counter(y)
    res=1.0
    for num in counter.values():
        p=num/len(y)
        res-=p**2
    return res

def try_split(X,y):
    best_g=float('inf')
    best_d,best_v=-1,-1
    for d in range(X.shape[1]):
        sorted_index=np.argsort(X[:,d])
        for i in range(1,len(X)):
            if X[sorted_index[i-1],d]!=X[sorted_index[i],d]:
                v=(X[sorted_index[i-1],d]+X[sorted_index[i],d])/2
                X_l,X_r,y_l,y_r=split(X,y,d,v)
                g=jini(y_l)+jini(y_r)
                if g
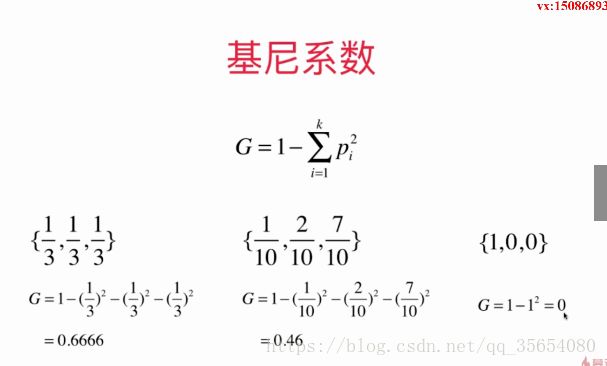
基尼系数和信息熵原理大致相同。
决策树解决回归问题
"""决策树解决回归问题"""
import numpy as np
import matplotlib.pyplot as plt
from sklearn import datasets
from sklearn.model_selection import train_test_split

boston=datasets.load_boston()
X=boston.data
y=boston.target
X_train,X_test,y_train,y_test=train_test_split(X,y,random_state=666)

from sklearn.tree import DecisionTreeRegressor
dt_reg=DecisionTreeRegressor()
dt_reg.fit(X_train,y_train)
print(dt_reg.score(X_test,y_test))
结果:
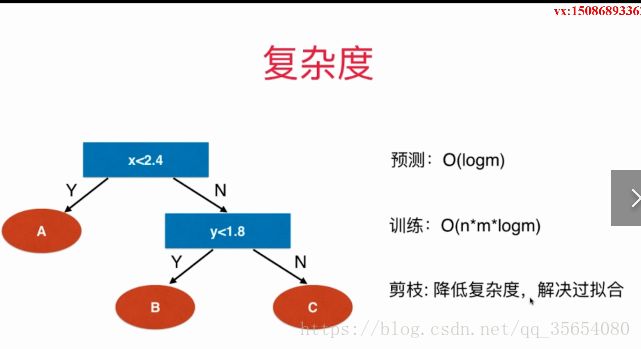
出现过拟合。
E:\pythonspace\KNN_function\venv\Scripts\python.exe E:/pythonspace/KNN_function/try.py
0.68499290930685

Process finished with exit code 0

