数据可视化
参考
目录
- 数据可视化
- 一、matplotlib、seaborn介绍
- 1.1 matplotlib
- 1.1.1 基本介绍
- 1.1.2导入惯例
- 1.1.3 pylop 与 pylab
- 1.2 seaborn
- 二、基础绘图
- 2.1 图表的基本元素
- 2.2 图表样式及注解
- 2.3 子图
- 3.分布数据
- 3.1 直方图
- 3.1.1 matplotlib
- 3.1.2 seaborn
- 3.1.3 密度图
- 3.2 散点图
- 3.2.1 matplotlib
- 3.2.2 seaborn
- 3.3 矩阵散点图
- 3.3.1 matplotlib
- 3.3.2 seaborn
- 4.分类数据可视化
一、matplotlib、seaborn介绍
1.1 matplotlib
1.1.1 基本介绍
官方文档
1.1.2导入惯例
import matplotlib.pyplot as plt
1.1.3 pylop 与 pylab
- matplotlib.pyplot是使Matplotlib像MATLAB一样工作的命令样式函数的集合。每个pyplot函数都会对图形进行一些更改:例如,创建图形,在图形中创建绘图区域,在绘图区域中绘制一些线,用标签装饰绘图等
- pylab是一个模块,其包括matplotlib.pyplot,numpy 和单个名称空间内的一些附加功能。它的最初目的是通过将所有函数导入全局名称空间来模仿类似于MATLAB的工作方式
- 由于大量导入全局名称空间可能会导致意外行为,因此强烈建议不要使用pylab。使用matplotlib.pyplot 代替
import matplotlib.pyplot as plt
import numpy as np
%matplotlib inline
1.2 seaborn
- Seaborn是基于matplotlib的Python数据可视化库。它提供了用于绘制引人入胜且内容丰富的统计图形的高级界面
- Seaborn是把matplotlib的部分功能根据常用组合进行封装,使初学者也能绘制出较为实用的图
- 难以实现特定需求的定制化图
- 初学可视化的同学建议以seaborn入手,可以满足大部分需求
官方教程
导入惯例
import seaborn as sns
二、基础绘图
from sklearn.datasets import load_boston
data = load_boston()
data
{'data': array([[6.3200e-03, 1.8000e+01, 2.3100e+00, ..., 1.5300e+01, 3.9690e+02,
         4.9800e+00],
        [2.7310e-02, 0.0000e+00, 7.0700e+00, ..., 1.7800e+01, 3.9690e+02,
         9.1400e+00],
        [2.7290e-02, 0.0000e+00, 7.0700e+00, ..., 1.7800e+01, 3.9283e+02,
         4.0300e+00],
        ...,
        [6.0760e-02, 0.0000e+00, 1.1930e+01, ..., 2.1000e+01, 3.9690e+02,
         5.6400e+00],
        [1.0959e-01, 0.0000e+00, 1.1930e+01, ..., 2.1000e+01, 3.9345e+02,
         6.4800e+00],
        [4.7410e-02, 0.0000e+00, 1.1930e+01, ..., 2.1000e+01, 3.9690e+02,
         7.8800e+00]]),
 'target': array([24. , 21.6, 34.7, 33.4, 36.2, 28.7, 22.9, 27.1, 16.5, 18.9, 15. ,
        18.9, 21.7, 20.4, 18.2, 19.9, 23.1, 17.5, 20.2, 18.2, 13.6, 19.6,
        15.2, 14.5, 15.6, 13.9, 16.6, 14.8, 18.4, 21. , 12.7, 14.5, 13.2,
        13.1, 13.5, 18.9, 20. , 21. , 24.7, 30.8, 34.9, 26.6, 25.3, 24.7,
        21.2, 19.3, 20. , 16.6, 14.4, 19.4, 19.7, 20.5, 25. , 23.4, 18.9,
        35.4, 24.7, 31.6, 23.3, 19.6, 18.7, 16. , 22.2, 25. , 33. , 23.5,
        19.4, 22. , 17.4, 20.9, 24.2, 21.7, 22.8, 23.4, 24.1, 21.4, 20. ,
        20.8, 21.2, 20.3, 28. , 23.9, 24.8, 22.9, 23.9, 26.6, 22.5, 22.2,
        23.6, 28.7, 22.6, 22. , 22.9, 25. , 20.6, 28.4, 21.4, 38.7, 43.8,
        33.2, 27.5, 26.5, 18.6, 19.3, 20.1, 19.5, 19.5, 20.4, 19.8, 19.4,
        21.7, 22.8, 18.8, 18.7, 18.5, 18.3, 21.2, 19.2, 20.4, 19.3, 22. ,
        20.3, 20.5, 17.3, 18.8, 21.4, 15.7, 16.2, 18. , 14.3, 19.2, 19.6,
        23. , 18.4, 15.6, 18.1, 17.4, 17.1, 13.3, 17.8, 14. , 14.4, 13.4,
        15.6, 11.8, 13.8, 15.6, 14.6, 17.8, 15.4, 21.5, 19.6, 15.3, 19.4,
        17. , 15.6, 13.1, 41.3, 24.3, 23.3, 27. , 50. , 50. , 50. , 22.7,
        25. , 50. , 23.8, 23.8, 22.3, 17.4, 19.1, 23.1, 23.6, 22.6, 29.4,
        23.2, 24.6, 29.9, 37.2, 39.8, 36.2, 37.9, 32.5, 26.4, 29.6, 50. ,
        32. , 29.8, 34.9, 37. , 30.5, 36.4, 31.1, 29.1, 50. , 33.3, 30.3,
        34.6, 34.9, 32.9, 24.1, 42.3, 48.5, 50. , 22.6, 24.4, 22.5, 24.4,
        20. , 21.7, 19.3, 22.4, 28.1, 23.7, 25. , 23.3, 28.7, 21.5, 23. ,
        26.7, 21.7, 27.5, 30.1, 44.8, 50. , 37.6, 31.6, 46.7, 31.5, 24.3,
        31.7, 41.7, 48.3, 29. , 24. , 25.1, 31.5, 23.7, 23.3, 22. , 20.1,
        22.2, 23.7, 17.6, 18.5, 24.3, 20.5, 24.5, 26.2, 24.4, 24.8, 29.6,
        42.8, 21.9, 20.9, 44. , 50. , 36. , 30.1, 33.8, 43.1, 48.8, 31. ,
        36.5, 22.8, 30.7, 50. , 43.5, 20.7, 21.1, 25.2, 24.4, 35.2, 32.4,
        32. , 33.2, 33.1, 29.1, 35.1, 45.4, 35.4, 46. , 50. , 32.2, 22. ,
        20.1, 23.2, 22.3, 24.8, 28.5, 37.3, 27.9, 23.9, 21.7, 28.6, 27.1,
        20.3, 22.5, 29. , 24.8, 22. , 26.4, 33.1, 36.1, 28.4, 33.4, 28.2,
        22.8, 20.3, 16.1, 22.1, 19.4, 21.6, 23.8, 16.2, 17.8, 19.8, 23.1,
        21. , 23.8, 23.1, 20.4, 18.5, 25. , 24.6, 23. , 22.2, 19.3, 22.6,
        19.8, 17.1, 19.4, 22.2, 20.7, 21.1, 19.5, 18.5, 20.6, 19. , 18.7,
        32.7, 16.5, 23.9, 31.2, 17.5, 17.2, 23.1, 24.5, 26.6, 22.9, 24.1,
        18.6, 30.1, 18.2, 20.6, 17.8, 21.7, 22.7, 22.6, 25. , 19.9, 20.8,
        16.8, 21.9, 27.5, 21.9, 23.1, 50. , 50. , 50. , 50. , 50. , 13.8,
        13.8, 15. , 13.9, 13.3, 13.1, 10.2, 10.4, 10.9, 11.3, 12.3,  8.8,
         7.2, 10.5,  7.4, 10.2, 11.5, 15.1, 23.2,  9.7, 13.8, 12.7, 13.1,
        12.5,  8.5,  5. ,  6.3,  5.6,  7.2, 12.1,  8.3,  8.5,  5. , 11.9,
        27.9, 17.2, 27.5, 15. , 17.2, 17.9, 16.3,  7. ,  7.2,  7.5, 10.4,
         8.8,  8.4, 16.7, 14.2, 20.8, 13.4, 11.7,  8.3, 10.2, 10.9, 11. ,
         9.5, 14.5, 14.1, 16.1, 14.3, 11.7, 13.4,  9.6,  8.7,  8.4, 12.8,
        10.5, 17.1, 18.4, 15.4, 10.8, 11.8, 14.9, 12.6, 14.1, 13. , 13.4,
        15.2, 16.1, 17.8, 14.9, 14.1, 12.7, 13.5, 14.9, 20. , 16.4, 17.7,
        19.5, 20.2, 21.4, 19.9, 19. , 19.1, 19.1, 20.1, 19.9, 19.6, 23.2,
        29.8, 13.8, 13.3, 16.7, 12. , 14.6, 21.4, 23. , 23.7, 25. , 21.8,
        20.6, 21.2, 19.1, 20.6, 15.2,  7. ,  8.1, 13.6, 20.1, 21.8, 24.5,
        23.1, 19.7, 18.3, 21.2, 17.5, 16.8, 22.4, 20.6, 23.9, 22. , 11.9]),
 'feature_names': array(['CRIM', 'ZN', 'INDUS', 'CHAS', 'NOX', 'RM', 'AGE', 'DIS', 'RAD',
        'TAX', 'PTRATIO', 'B', 'LSTAT'], dtype='
import pandas as pd
x_df = pd.DataFrame(data['data'],columns=data['feature_names'])
x_df.head()
|
CRIM |
ZN |
INDUS |
CHAS |
NOX |
RM |
AGE |
DIS |
RAD |
TAX |
PTRATIO |
B |
LSTAT |
| 0 |
0.00632 |
18.0 |
2.31 |
0.0 |
0.538 |
6.575 |
65.2 |
4.0900 |
1.0 |
296.0 |
15.3 |
396.90 |
4.98 |
| 1 |
0.02731 |
0.0 |
7.07 |
0.0 |
0.469 |
6.421 |
78.9 |
4.9671 |
2.0 |
242.0 |
17.8 |
396.90 |
9.14 |
| 2 |
0.02729 |
0.0 |
7.07 |
0.0 |
0.469 |
7.185 |
61.1 |
4.9671 |
2.0 |
242.0 |
17.8 |
392.83 |
4.03 |
| 3 |
0.03237 |
0.0 |
2.18 |
0.0 |
0.458 |
6.998 |
45.8 |
6.0622 |
3.0 |
222.0 |
18.7 |
394.63 |
2.94 |
| 4 |
0.06905 |
0.0 |
2.18 |
0.0 |
0.458 |
7.147 |
54.2 |
6.0622 |
3.0 |
222.0 |
18.7 |
396.90 |
5.33 |
x_df.T.head()
|
0 |
1 |
2 |
3 |
4 |
5 |
6 |
7 |
8 |
9 |
... |
496 |
497 |
498 |
499 |
500 |
501 |
502 |
503 |
504 |
505 |
| CRIM |
0.00632 |
0.02731 |
0.02729 |
0.03237 |
0.06905 |
0.02985 |
0.08829 |
0.14455 |
0.21124 |
0.17004 |
... |
0.2896 |
0.26838 |
0.23912 |
0.17783 |
0.22438 |
0.06263 |
0.04527 |
0.06076 |
0.10959 |
0.04741 |
| ZN |
18.00000 |
0.00000 |
0.00000 |
0.00000 |
0.00000 |
0.00000 |
12.50000 |
12.50000 |
12.50000 |
12.50000 |
... |
0.0000 |
0.00000 |
0.00000 |
0.00000 |
0.00000 |
0.00000 |
0.00000 |
0.00000 |
0.00000 |
0.00000 |
| INDUS |
2.31000 |
7.07000 |
7.07000 |
2.18000 |
2.18000 |
2.18000 |
7.87000 |
7.87000 |
7.87000 |
7.87000 |
... |
9.6900 |
9.69000 |
9.69000 |
9.69000 |
9.69000 |
11.93000 |
11.93000 |
11.93000 |
11.93000 |
11.93000 |
| CHAS |
0.00000 |
0.00000 |
0.00000 |
0.00000 |
0.00000 |
0.00000 |
0.00000 |
0.00000 |
0.00000 |
0.00000 |
... |
0.0000 |
0.00000 |
0.00000 |
0.00000 |
0.00000 |
0.00000 |
0.00000 |
0.00000 |
0.00000 |
0.00000 |
| NOX |
0.53800 |
0.46900 |
0.46900 |
0.45800 |
0.45800 |
0.45800 |
0.52400 |
0.52400 |
0.52400 |
0.52400 |
... |
0.5850 |
0.58500 |
0.58500 |
0.58500 |
0.58500 |
0.57300 |
0.57300 |
0.57300 |
0.57300 |
0.57300 |
5 rows × 506 columns
y_df = pd.DataFrame(data['target'])
y_df.head()
|
0 |
| 0 |
24.0 |
| 1 |
21.6 |
| 2 |
34.7 |
| 3 |
33.4 |
| 4 |
36.2 |
2.1 图表的基本元素
%matplotlib inline
import numpy as np
import pandas as pd
import matplotlib.pyplot as plt
from scipy import stats
import seaborn as sns
9.8*500
4900.0
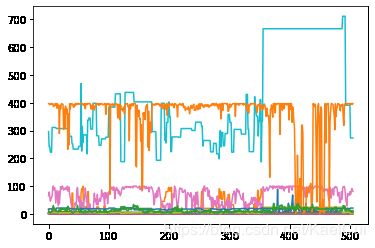
plt.plot(x_df)
[,
 ,
 ,
 ,
 ,
 ,
 ,
 ,
 ,
 ,
 ,
 ,
 ]
plt.plot(np.linspace(1,10,50),np.sin(np.linspace(1,10,50)))
[]

- 图名
- x轴标签
- y轴标签
- 图例
- x轴边界
- y轴边界
- x刻度
- y刻度
- x刻度标签
- y刻度标签
data_df.head()
---------------------------------------------------------------------------

NameError                                 Traceback (most recent call last)

 in
----> 1 data_df.head()


NameError: name 'data_df' is not defined
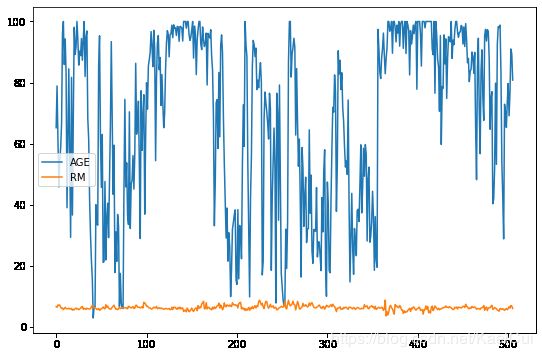
data_df = pd.DataFrame(x_df[['AGE','RM']])
fig = data_df.plot(figsize=(9,6))
2.2 图表样式及注解
- linestyle
- color
- marker
- style (linestyle、marker、color)
- alpha
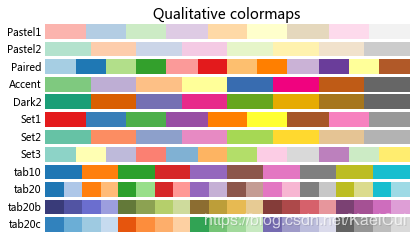
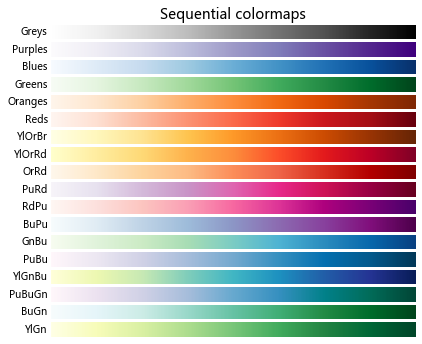
- colormap #Matplotlib附带的色彩映射
- grid
- text
help(plt.plot)
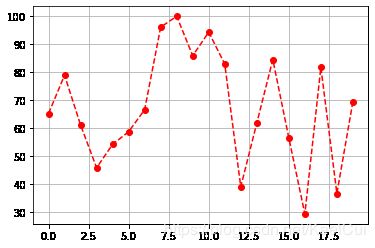
df = x_df['AGE'][0:20]
df.plot(linestyle = '--',
       marker = 'o',
       color="r",
      grid=True)
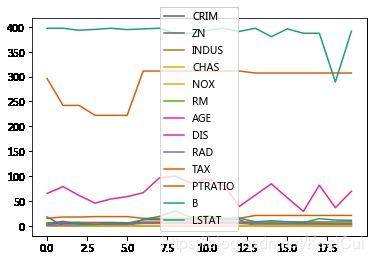
x_df[0:20].plot(colormap = 'Dark2_r')
cmaps = [('Perceptually Uniform Sequential', [
            'viridis', 'plasma', 'inferno', 'magma', 'cividis']),
         ('Sequential', [
            'Greys', 'Purples', 'Blues', 'Greens', 'Oranges', 'Reds',
            'YlOrBr', 'YlOrRd', 'OrRd', 'PuRd', 'RdPu', 'BuPu',
            'GnBu', 'PuBu', 'YlGnBu', 'PuBuGn', 'BuGn', 'YlGn']),
         ('Sequential (2)', [
            'binary', 'gist_yarg', 'gist_gray', 'gray', 'bone', 'pink',
            'spring', 'summer', 'autumn', 'winter', 'cool', 'Wistia',
            'hot', 'afmhot', 'gist_heat', 'copper']),
         ('Diverging', [
            'PiYG', 'PRGn', 'BrBG', 'PuOr', 'RdGy', 'RdBu',
            'RdYlBu', 'RdYlGn', 'Spectral', 'coolwarm', 'bwr', 'seismic']),
         ('Cyclic', ['twilight', 'twilight_shifted', 'hsv']),
         ('Qualitative', [
            'Pastel1', 'Pastel2', 'Paired', 'Accent',
            'Dark2', 'Set1', 'Set2', 'Set3',
            'tab10', 'tab20', 'tab20b', 'tab20c']),
         ('Miscellaneous', [
            'flag', 'prism', 'ocean', 'gist_earth', 'terrain', 'gist_stern',
            'gnuplot', 'gnuplot2', 'CMRmap', 'cubehelix', 'brg',
            'gist_rainbow', 'rainbow', 'jet', 'nipy_spectral', 'gist_ncar'])]
gradient = np.linspace(0, 1, 256)
gradient = np.vstack((gradient, gradient))
def plot_color_gradients(cmap_category, cmap_list):
nrows = len(cmap_list)
figh = 0.35 + 0.15 + (nrows + (nrows-1)*0.1)*0.22
fig, axes = plt.subplots(nrows=nrows, figsize=(6.4, figh))
fig.subplots_adjust(top=1-.35/figh, bottom=.15/figh, left=0.2, right=0.99)
axes[0].set_title(cmap_category + ' colormaps', fontsize=14)
for ax, name in zip(axes, cmap_list):
ax.imshow(gradient, aspect='auto', cmap=plt.get_cmap(name))
ax.text(-.01, .5, name, va='center', ha='right', fontsize=10,
transform=ax.transAxes)
for ax in axes:
ax.set_axis_off()
for cmap_category, cmap_list in cmaps:
plot_color_gradients(cmap_category, cmap_list)




df.plot(style = 'o')
plt.plot(df.argmax(),df.max(),marker = 'o',color = 'r')
plt.text(df.argmax(),max(df),'max_age',fontsize=12)
Text(8, 100.0, 'max_age')

sns.plot
2.3 子图
help(plt.figure)
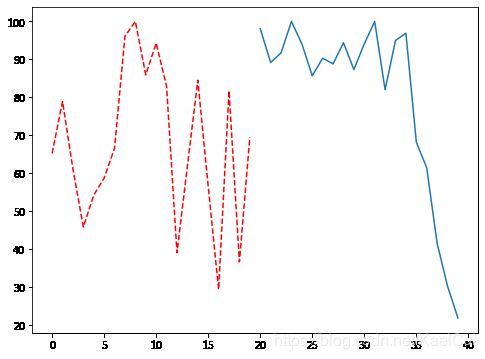
fig_1 = plt.figure(num=1,figsize=(8,6))
plt.plot(df,'r--')
fig_2 = plt.figure(num=1,figsize=(8,6))
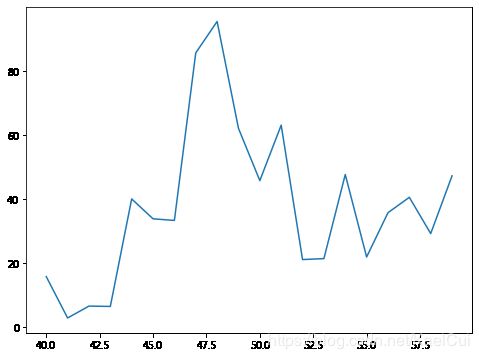
plt.plot(x_df['AGE'][20:40])
fig_2 = plt.figure(num=2,figsize=(8,6))
plt.plot(x_df['AGE'][40:60])
[]
help(plt.subplots)
fig,axes = plt.subplots(2,3,figsize=(10,4))
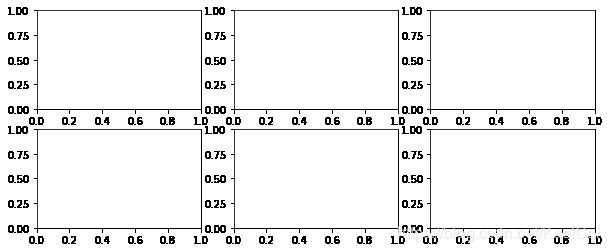
fig

axes
array([[,
        ,
        ],
       [,
        ,
        ]],
      dtype=object)
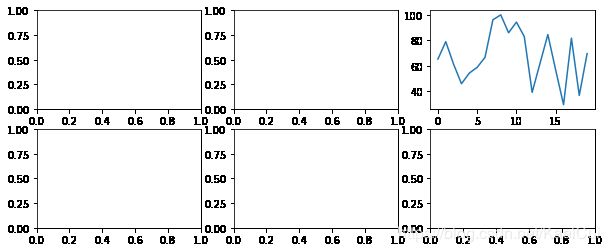
ax1 = axes[0,2]
ax1.plot(df)
fig
fig,axes = plt.subplots(2,3,figsize=(10,4) ,sharex = True,sharey =True)
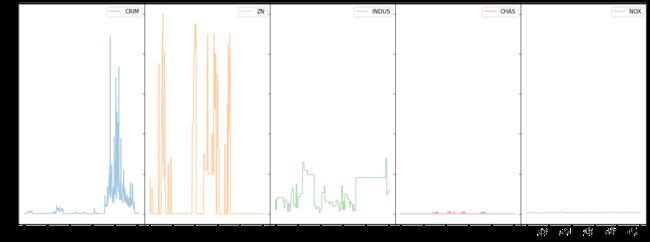
df_4 = x_df[['CRIM', 'ZN', 'INDUS', 'CHAS', 'NOX']]
df_4.plot(style = '-',alpha = 0.4,figsize = (20,8),
       subplots = True,
       layout = (1,5),
        sharey = True)
plt.subplots_adjust(wspace=0,hspace=0.2)
x_df
|
CRIM |
ZN |
INDUS |
CHAS |
NOX |
RM |
AGE |
DIS |
RAD |
TAX |
PTRATIO |
B |
LSTAT |
| 0 |
0.00632 |
18.0 |
2.31 |
0.0 |
0.538 |
6.575 |
65.2 |
4.0900 |
1.0 |
296.0 |
15.3 |
396.90 |
4.98 |
| 1 |
0.02731 |
0.0 |
7.07 |
0.0 |
0.469 |
6.421 |
78.9 |
4.9671 |
2.0 |
242.0 |
17.8 |
396.90 |
9.14 |
| 2 |
0.02729 |
0.0 |
7.07 |
0.0 |
0.469 |
7.185 |
61.1 |
4.9671 |
2.0 |
242.0 |
17.8 |
392.83 |
4.03 |
| 3 |
0.03237 |
0.0 |
2.18 |
0.0 |
0.458 |
6.998 |
45.8 |
6.0622 |
3.0 |
222.0 |
18.7 |
394.63 |
2.94 |
| 4 |
0.06905 |
0.0 |
2.18 |
0.0 |
0.458 |
7.147 |
54.2 |
6.0622 |
3.0 |
222.0 |
18.7 |
396.90 |
5.33 |
| ... |
... |
... |
... |
... |
... |
... |
... |
... |
... |
... |
... |
... |
... |
| 501 |
0.06263 |
0.0 |
11.93 |
0.0 |
0.573 |
6.593 |
69.1 |
2.4786 |
1.0 |
273.0 |
21.0 |
391.99 |
9.67 |
| 502 |
0.04527 |
0.0 |
11.93 |
0.0 |
0.573 |
6.120 |
76.7 |
2.2875 |
1.0 |
273.0 |
21.0 |
396.90 |
9.08 |
| 503 |
0.06076 |
0.0 |
11.93 |
0.0 |
0.573 |
6.976 |
91.0 |
2.1675 |
1.0 |
273.0 |
21.0 |
396.90 |
5.64 |
| 504 |
0.10959 |
0.0 |
11.93 |
0.0 |
0.573 |
6.794 |
89.3 |
2.3889 |
1.0 |
273.0 |
21.0 |
393.45 |
6.48 |
| 505 |
0.04741 |
0.0 |
11.93 |
0.0 |
0.573 |
6.030 |
80.8 |
2.5050 |
1.0 |
273.0 |
21.0 |
396.90 |
7.88 |
506 rows × 13 columns
df_4.plot(style = '-',alpha = 0.4,figsize = (20,8),
       subplots = False,
       layout = (1,5),
        sharey = True)
plt.subplots_adjust(wspace=0,hspace=0)

3.分布数据
datasets.load_iris
---------------------------------------------------------------------------

NameError                                 Traceback (most recent call last)

 in
----> 1 datasets.load_iris


NameError: name 'datasets' is not defined
x_df.head()
|
CRIM |
ZN |
INDUS |
CHAS |
NOX |
RM |
AGE |
DIS |
RAD |
TAX |
PTRATIO |
B |
LSTAT |
| 0 |
0.00632 |
18.0 |
2.31 |
0.0 |
0.538 |
6.575 |
65.2 |
4.0900 |
1.0 |
296.0 |
15.3 |
396.90 |
4.98 |
| 1 |
0.02731 |
0.0 |
7.07 |
0.0 |
0.469 |
6.421 |
78.9 |
4.9671 |
2.0 |
242.0 |
17.8 |
396.90 |
9.14 |
| 2 |
0.02729 |
0.0 |
7.07 |
0.0 |
0.469 |
7.185 |
61.1 |
4.9671 |
2.0 |
242.0 |
17.8 |
392.83 |
4.03 |
| 3 |
0.03237 |
0.0 |
2.18 |
0.0 |
0.458 |
6.998 |
45.8 |
6.0622 |
3.0 |
222.0 |
18.7 |
394.63 |
2.94 |
| 4 |
0.06905 |
0.0 |
2.18 |
0.0 |
0.458 |
7.147 |
54.2 |
6.0622 |
3.0 |
222.0 |
18.7 |
396.90 |
5.33 |
y_df.head()
|
0 |
| 0 |
24.0 |
| 1 |
21.6 |
| 2 |
34.7 |
| 3 |
33.4 |
| 4 |
36.2 |
3.1 直方图
3.1.1 matplotlib
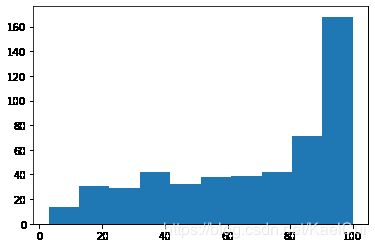
plt.hist(x_df['AGE'])
(array([ 14.,  31.,  29.,  42.,  32.,  38.,  39.,  42.,  71., 168.]),
 array([  2.9 ,  12.61,  22.32,  32.03,  41.74,  51.45,  61.16,  70.87,
         80.58,  90.29, 100.  ]),
 )
3.1.2 seaborn
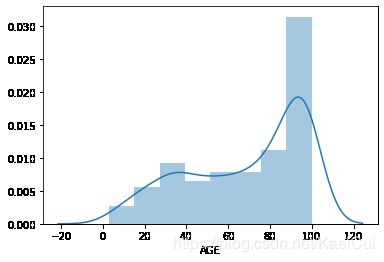
sns.distplot(x_df['AGE'])
sns.distplot(x_df['AGE'],
bins = 10,
hist = True,
kde = True,
norm_hist=True,
rug = True,
vertical = False,
color = 'y',
axlabel = 'x')

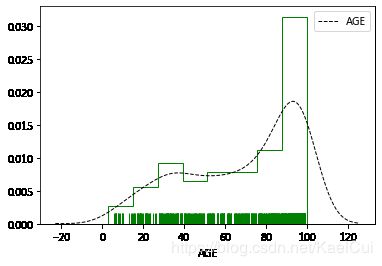
sns.distplot(x_df['AGE'],
rug = True,
rug_kws = {'color':'g'} ,
kde_kws={"color": "k", "lw": 1, "label": "AGE",'linestyle':'--'},
hist_kws={"histtype": "step", "linewidth": 1,"alpha": 1, "color": "g"})
3.1.3 密度图
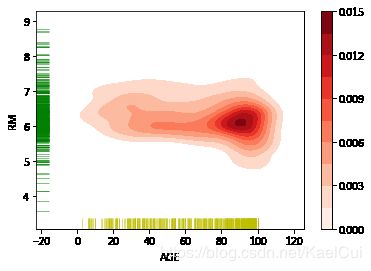
sns.kdeplot(x_df['AGE'],x_df['RM'],
cbar = True,
shade = True,
cmap = 'Reds',
shade_lowest=False,
n_levels = 10
)
sns.rugplot(x_df['AGE'], color="y", axis='x',alpha = 0.5)
sns.rugplot(x_df['RM'], color="g", axis='y',alpha = 0.5)
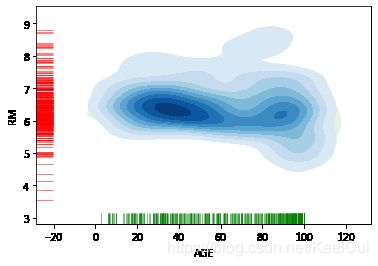
sns.kdeplot(x_df['AGE'][0:200],x_df['RM'][0:200],cmap = 'Greens',
shade = True,shade_lowest=False)
sns.kdeplot(x_df['AGE'][200:400],x_df['RM'][200:400],cmap = 'Blues',
shade = True,shade_lowest=False)
sns.rugplot(x_df['AGE'][0:400], color="g", axis='x',alpha = 0.5)
sns.rugplot(x_df['RM'][0:400], color="r", axis='y',alpha = 0.5)
3.2 散点图
3.2.1 matplotlib
plt.scatter(range(0,y_df.shape[0]),
x_df['AGE'],
marker='.',
s = (y_df-y_df.mean())*10,
cmap = 'Reds_r',
alpha = 1,)

3.2.2 seaborn
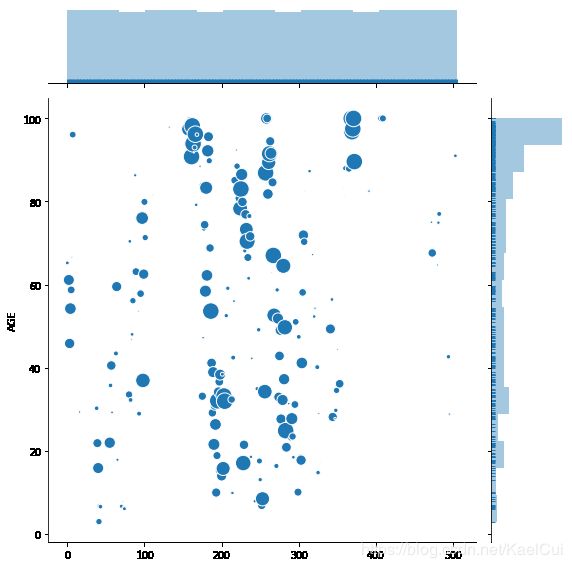
sns.jointplot(range(0,y_df.shape[0]), y=x_df['AGE'],
data=x_df,
s = (y_df-y_df.mean())*10,
edgecolor="w",linewidth=1,
kind = 'scatter',
space = 0.2,
size = 8,
ratio = 5,
marginal_kws=dict(bins=15, rug=True)
)
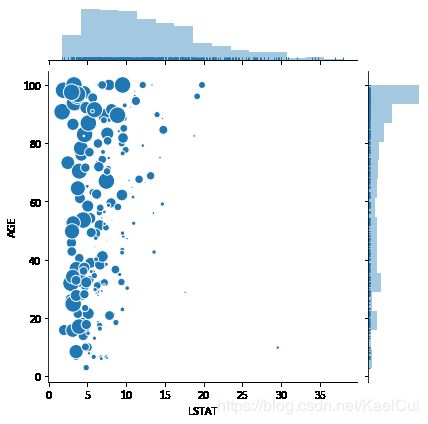
sns.jointplot(x=x_df['LSTAT'], y=x_df['AGE'],
data=x_df,
s = (y_df-y_df.mean())*10,
edgecolor="w",linewidth=1,
kind = 'scatter',
marginal_kws=dict(bins=15, rug=True)
)
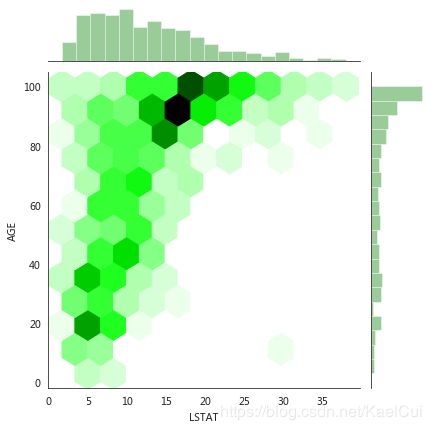
with sns.axes_style("white"):
    sns.jointplot(x=x_df['LSTAT'], y=x_df['AGE'],data = x_df, kind="hex", color="g",
                 marginal_kws=dict(bins=20))
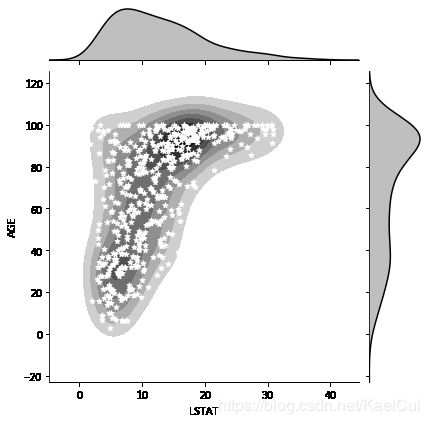
g = sns.jointplot(x=x_df['LSTAT'], y=x_df['AGE'],data = x_df,
kind="kde", color="k",
shade_lowest=False)
g.plot_joint(plt.scatter,c="w", s=30, linewidth=1, marker="*")
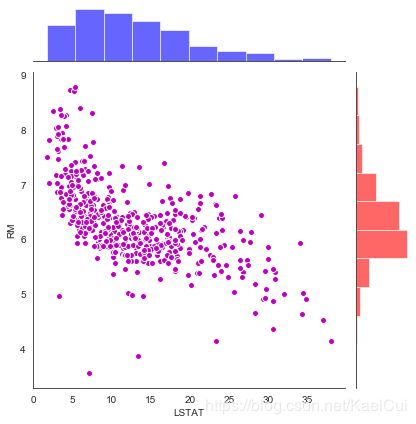
sns.set_style("white")
g = sns.JointGrid(x='LSTAT', y='RM', data=x_df)
g.plot_joint(plt.scatter, color ='m', edgecolor = 'white')
g.ax_marg_x.hist(x_df['LSTAT'], color="b", alpha=.6)
g.ax_marg_y.hist(x_df['RM'], color="r", alpha=.6,
orientation="horizontal")
(array([  2.,   4.,  14.,  45., 177., 151.,  69.,  22.,  13.,   9.]),
 array([3.561 , 4.0829, 4.6048, 5.1267, 5.6486, 6.1705, 6.6924, 7.2143,
        7.7362, 8.2581, 8.78  ]),
 )
3.3 矩阵散点图
3.3.1 matplotlib
from sklearn.datasets import load_iris
iris = load_iris()
iris
{'data': array([[5.1, 3.5, 1.4, 0.2],
        [4.9, 3. , 1.4, 0.2],
        [4.7, 3.2, 1.3, 0.2],
        [4.6, 3.1, 1.5, 0.2],
        [5. , 3.6, 1.4, 0.2],
        [5.4, 3.9, 1.7, 0.4],
        [4.6, 3.4, 1.4, 0.3],
        [5. , 3.4, 1.5, 0.2],
        [4.4, 2.9, 1.4, 0.2],
        [4.9, 3.1, 1.5, 0.1],
        [5.4, 3.7, 1.5, 0.2],
        [4.8, 3.4, 1.6, 0.2],
        [4.8, 3. , 1.4, 0.1],
        [4.3, 3. , 1.1, 0.1],
        [5.8, 4. , 1.2, 0.2],
        [5.7, 4.4, 1.5, 0.4],
        [5.4, 3.9, 1.3, 0.4],
        [5.1, 3.5, 1.4, 0.3],
        [5.7, 3.8, 1.7, 0.3],
        [5.1, 3.8, 1.5, 0.3],
        [5.4, 3.4, 1.7, 0.2],
        [5.1, 3.7, 1.5, 0.4],
        [4.6, 3.6, 1. , 0.2],
        [5.1, 3.3, 1.7, 0.5],
        [4.8, 3.4, 1.9, 0.2],
        [5. , 3. , 1.6, 0.2],
        [5. , 3.4, 1.6, 0.4],
        [5.2, 3.5, 1.5, 0.2],
        [5.2, 3.4, 1.4, 0.2],
        [4.7, 3.2, 1.6, 0.2],
        [4.8, 3.1, 1.6, 0.2],
        [5.4, 3.4, 1.5, 0.4],
        [5.2, 4.1, 1.5, 0.1],
        [5.5, 4.2, 1.4, 0.2],
        [4.9, 3.1, 1.5, 0.2],
        [5. , 3.2, 1.2, 0.2],
        [5.5, 3.5, 1.3, 0.2],
        [4.9, 3.6, 1.4, 0.1],
        [4.4, 3. , 1.3, 0.2],
        [5.1, 3.4, 1.5, 0.2],
        [5. , 3.5, 1.3, 0.3],
        [4.5, 2.3, 1.3, 0.3],
        [4.4, 3.2, 1.3, 0.2],
        [5. , 3.5, 1.6, 0.6],
        [5.1, 3.8, 1.9, 0.4],
        [4.8, 3. , 1.4, 0.3],
        [5.1, 3.8, 1.6, 0.2],
        [4.6, 3.2, 1.4, 0.2],
        [5.3, 3.7, 1.5, 0.2],
        [5. , 3.3, 1.4, 0.2],
        [7. , 3.2, 4.7, 1.4],
        [6.4, 3.2, 4.5, 1.5],
        [6.9, 3.1, 4.9, 1.5],
        [5.5, 2.3, 4. , 1.3],
        [6.5, 2.8, 4.6, 1.5],
        [5.7, 2.8, 4.5, 1.3],
        [6.3, 3.3, 4.7, 1.6],
        [4.9, 2.4, 3.3, 1. ],
        [6.6, 2.9, 4.6, 1.3],
        [5.2, 2.7, 3.9, 1.4],
        [5. , 2. , 3.5, 1. ],
        [5.9, 3. , 4.2, 1.5],
        [6. , 2.2, 4. , 1. ],
        [6.1, 2.9, 4.7, 1.4],
        [5.6, 2.9, 3.6, 1.3],
        [6.7, 3.1, 4.4, 1.4],
        [5.6, 3. , 4.5, 1.5],
        [5.8, 2.7, 4.1, 1. ],
        [6.2, 2.2, 4.5, 1.5],
        [5.6, 2.5, 3.9, 1.1],
        [5.9, 3.2, 4.8, 1.8],
        [6.1, 2.8, 4. , 1.3],
        [6.3, 2.5, 4.9, 1.5],
        [6.1, 2.8, 4.7, 1.2],
        [6.4, 2.9, 4.3, 1.3],
        [6.6, 3. , 4.4, 1.4],
        [6.8, 2.8, 4.8, 1.4],
        [6.7, 3. , 5. , 1.7],
        [6. , 2.9, 4.5, 1.5],
        [5.7, 2.6, 3.5, 1. ],
        [5.5, 2.4, 3.8, 1.1],
        [5.5, 2.4, 3.7, 1. ],
        [5.8, 2.7, 3.9, 1.2],
        [6. , 2.7, 5.1, 1.6],
        [5.4, 3. , 4.5, 1.5],
        [6. , 3.4, 4.5, 1.6],
        [6.7, 3.1, 4.7, 1.5],
        [6.3, 2.3, 4.4, 1.3],
        [5.6, 3. , 4.1, 1.3],
        [5.5, 2.5, 4. , 1.3],
        [5.5, 2.6, 4.4, 1.2],
        [6.1, 3. , 4.6, 1.4],
        [5.8, 2.6, 4. , 1.2],
        [5. , 2.3, 3.3, 1. ],
        [5.6, 2.7, 4.2, 1.3],
        [5.7, 3. , 4.2, 1.2],
        [5.7, 2.9, 4.2, 1.3],
        [6.2, 2.9, 4.3, 1.3],
        [5.1, 2.5, 3. , 1.1],
        [5.7, 2.8, 4.1, 1.3],
        [6.3, 3.3, 6. , 2.5],
        [5.8, 2.7, 5.1, 1.9],
        [7.1, 3. , 5.9, 2.1],
        [6.3, 2.9, 5.6, 1.8],
        [6.5, 3. , 5.8, 2.2],
        [7.6, 3. , 6.6, 2.1],
        [4.9, 2.5, 4.5, 1.7],
        [7.3, 2.9, 6.3, 1.8],
        [6.7, 2.5, 5.8, 1.8],
        [7.2, 3.6, 6.1, 2.5],
        [6.5, 3.2, 5.1, 2. ],
        [6.4, 2.7, 5.3, 1.9],
        [6.8, 3. , 5.5, 2.1],
        [5.7, 2.5, 5. , 2. ],
        [5.8, 2.8, 5.1, 2.4],
        [6.4, 3.2, 5.3, 2.3],
        [6.5, 3. , 5.5, 1.8],
        [7.7, 3.8, 6.7, 2.2],
        [7.7, 2.6, 6.9, 2.3],
        [6. , 2.2, 5. , 1.5],
        [6.9, 3.2, 5.7, 2.3],
        [5.6, 2.8, 4.9, 2. ],
        [7.7, 2.8, 6.7, 2. ],
        [6.3, 2.7, 4.9, 1.8],
        [6.7, 3.3, 5.7, 2.1],
        [7.2, 3.2, 6. , 1.8],
        [6.2, 2.8, 4.8, 1.8],
        [6.1, 3. , 4.9, 1.8],
        [6.4, 2.8, 5.6, 2.1],
        [7.2, 3. , 5.8, 1.6],
        [7.4, 2.8, 6.1, 1.9],
        [7.9, 3.8, 6.4, 2. ],
        [6.4, 2.8, 5.6, 2.2],
        [6.3, 2.8, 5.1, 1.5],
        [6.1, 2.6, 5.6, 1.4],
        [7.7, 3. , 6.1, 2.3],
        [6.3, 3.4, 5.6, 2.4],
        [6.4, 3.1, 5.5, 1.8],
        [6. , 3. , 4.8, 1.8],
        [6.9, 3.1, 5.4, 2.1],
        [6.7, 3.1, 5.6, 2.4],
        [6.9, 3.1, 5.1, 2.3],
        [5.8, 2.7, 5.1, 1.9],
        [6.8, 3.2, 5.9, 2.3],
        [6.7, 3.3, 5.7, 2.5],
        [6.7, 3. , 5.2, 2.3],
        [6.3, 2.5, 5. , 1.9],
        [6.5, 3. , 5.2, 2. ],
        [6.2, 3.4, 5.4, 2.3],
        [5.9, 3. , 5.1, 1.8]]),
 'target': array([0, 0, 0, 0, 0, 0, 0, 0, 0, 0, 0, 0, 0, 0, 0, 0, 0, 0, 0, 0, 0, 0,
        0, 0, 0, 0, 0, 0, 0, 0, 0, 0, 0, 0, 0, 0, 0, 0, 0, 0, 0, 0, 0, 0,
        0, 0, 0, 0, 0, 0, 1, 1, 1, 1, 1, 1, 1, 1, 1, 1, 1, 1, 1, 1, 1, 1,
        1, 1, 1, 1, 1, 1, 1, 1, 1, 1, 1, 1, 1, 1, 1, 1, 1, 1, 1, 1, 1, 1,
        1, 1, 1, 1, 1, 1, 1, 1, 1, 1, 1, 1, 2, 2, 2, 2, 2, 2, 2, 2, 2, 2,
        2, 2, 2, 2, 2, 2, 2, 2, 2, 2, 2, 2, 2, 2, 2, 2, 2, 2, 2, 2, 2, 2,
        2, 2, 2, 2, 2, 2, 2, 2, 2, 2, 2, 2, 2, 2, 2, 2, 2, 2]),
 'target_names': array(['setosa', 'versicolor', 'virginica'], dtype='
iris_x = pd.DataFrame(iris['data'],columns=iris['feature_names'])
iris_x.head()
|
sepal length (cm) |
sepal width (cm) |
petal length (cm) |
petal width (cm) |
| 0 |
5.1 |
3.5 |
1.4 |
0.2 |
| 1 |
4.9 |
3.0 |
1.4 |
0.2 |
| 2 |
4.7 |
3.2 |
1.3 |
0.2 |
| 3 |
4.6 |
3.1 |
1.5 |
0.2 |
| 4 |
5.0 |
3.6 |
1.4 |
0.2 |
iris_y = pd.DataFrame(iris['target'])
iris_y
|
0 |
| 0 |
0 |
| 1 |
0 |
| 2 |
0 |
| 3 |
0 |
| 4 |
0 |
| ... |
... |
| 145 |
2 |
| 146 |
2 |
| 147 |
2 |
| 148 |
2 |
| 149 |
2 |
150 rows × 1 columns
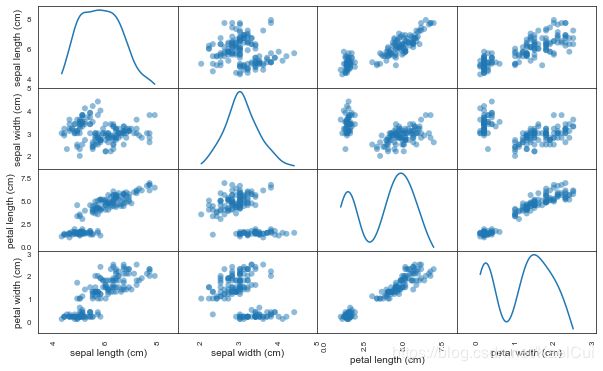
from pandas.plotting import scatter_matrix
scatter_matrix(iris_x,figsize=(10,6),
                 marker = 'o',
                 diagonal='kde',
                 alpha = 0.5,
                 range_padding=0.5,
                  cmap='Summer')
array([[,
        ,
        ,
        ],
       [,
        ,
        ,
        ],
       [,
        ,
        ,
        ],
       [,
        ,
        ,
        ]],
      dtype=object)
3.3.2 seaborn
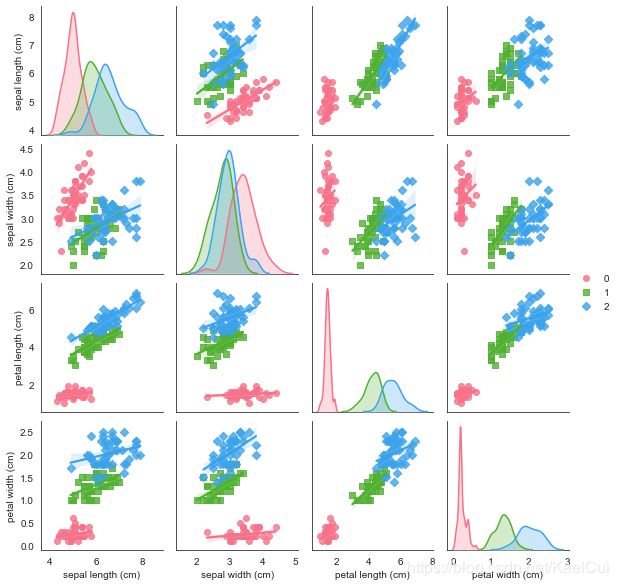
sns.pairplot(iris_x.join(iris_y),
kind = 'reg',
diag_kind="kde",
hue=0,
palette="husl",
markers=["o", "s", "D"],
size = 2,
)
/Users/edz/opt/anaconda3/lib/python3.7/site-packages/seaborn/axisgrid.py:2079: UserWarning: The `size` parameter has been renamed to `height`; please update your code.
  warnings.warn(msg, UserWarning)
iris['feature_names']
['sepal length (cm)',
 'sepal width (cm)',
 'petal length (cm)',
 'petal width (cm)']
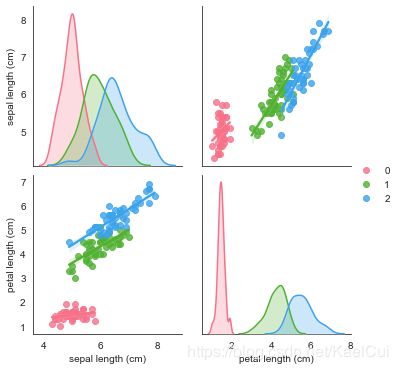
sns.pairplot(iris_x.join(iris_y),vars=['sepal length (cm)', 'petal length (cm)'],
             kind = 'reg', diag_kind="kde",
             hue=0, palette="husl")
4.分类数据可视化
data['feature_names']
array(['CRIM', 'ZN', 'INDUS', 'CHAS', 'NOX', 'RM', 'AGE', 'DIS', 'RAD',
       'TAX', 'PTRATIO', 'B', 'LSTAT'], dtype='
4.1 分类散点图
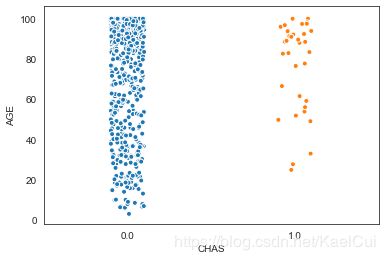
sns.stripplot(x="CHAS",
y=0,
data=x_df.join(y_df),
jitter = True,
size = 5, edgecolor = 'w',linewidth=1,marker = 'o'
)
ZN
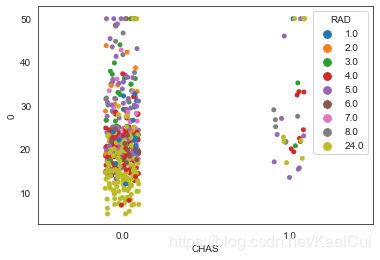
sns.stripplot(x="CHAS",
              y=0,
              hue="RAD",
              data=x_df.join(y_df),
              jitter=True)
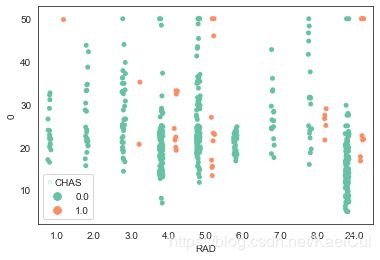
sns.stripplot(x="RAD",
y=0,
hue="CHAS",
data=x_df.join(y_df),
jitter=True,
palette="Set2",
dodge=True,
)
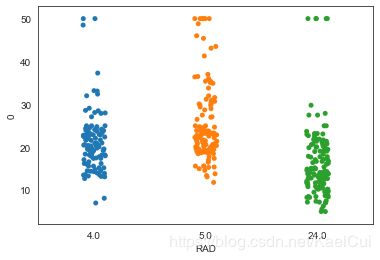
print(x_df['RAD'].value_counts())
sns.stripplot(x='RAD', y=0, data=x_df.join(y_df),jitter = True,
order = [4.0,5.0,24.0])
24.0    132
5.0     115
4.0     110
3.0      38
6.0      26
8.0      24
2.0      24
1.0      20
7.0      17
Name: RAD, dtype: int64
