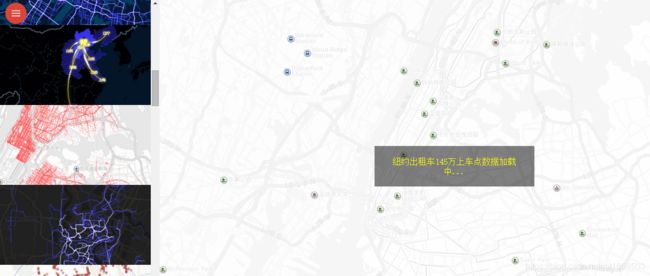
行车轨迹的热力图及轨迹图展示
前一段时间研究行车轨迹在地图上的展示,有些收获,这里分享一下。
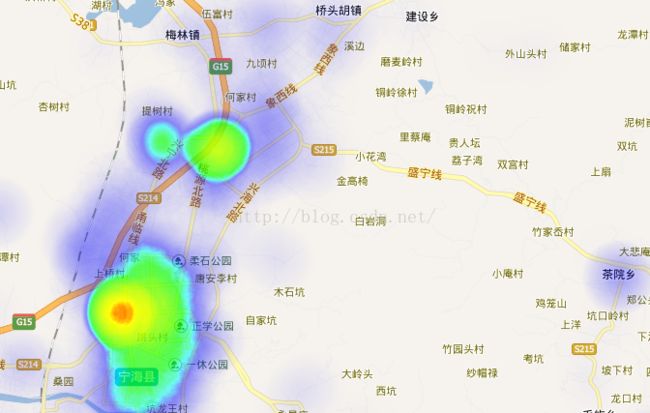
此为热力图效果:
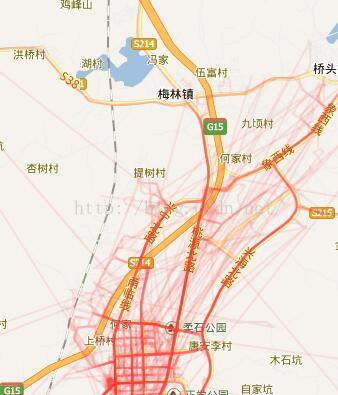
此为轨迹图效果:
下面分别详细说明:
1.热力图相对简单,只要调用百度地图的js接口即可。
js部分代码:
heatmap : function(dom, datas) {//dom是地图加载的div,datas是后台传入的数据
			var map = zh.baidumap.createMap(dom, datas.center[0],
					datas.center[1], datas.level || 16);

			/** * 基本控件begin ** */
			map.enableScrollWheelZoom();
			map.addControl(new BMap.NavigationControl());
			map.addControl(new BMap.ScaleControl());
			map.addControl(new BMap.OverviewMapControl());
			map.addControl(new BMap.MapTypeControl());
			/** * 基本控件end ** */

			if (!isSupportCanvas()) {
				alert('热力图目前只支持有canvas支持的浏览器,您所使用的浏览器不能使用热力图功能~')
			}

			/** * 热力图接口调用begin ** */
			var hmap = zh.baidumap.createHeatMap(map, {
				data : datas.points,
				max : datas.count * 10
			});
			/** * 热力图接口调用end ** */
			hmap.show();
datas数据结构:List
public List getPointList(Map map_in) {
List2、轨迹图的展示是调用第三方mapv的接口,目前使用的情况还算一般,在数据量太大的情况下地图非常卡慢。因为轨迹的机制是在百度地图上添加覆盖物,轨迹点一旦太多就难免会卡,希望以后百度地图会有更好的解决方案。
js部分代码:
pathmap : function(dom, datas) {
			var map = zh.baidumap.createMap(dom, datas.center[0],
					datas.center[1], datas.level || 16);

			/** * 基本控件begin ** */
			map.enableScrollWheelZoom();
			map.addControl(new BMap.NavigationControl());
			map.addControl(new BMap.ScaleControl());
			map.addControl(new BMap.OverviewMapControl());
			map.addControl(new BMap.MapTypeControl());
			/** * 基本控件end ** */

			/** * mapv一般轨迹接口begin ** */
			var mapv = new Mapv({
				drawTypeControl : true,
				map : map
			});

			var driveData = datas.points;

			var layer = new Mapv.Layer({
				zIndex : 1,
				mapv : mapv,
				dataType : 'polyline',
				coordType : 'bd09ll',	//这个参数是设置gps坐标类型的
				data : driveData,
				drawType : 'simple',
				drawOptions : {
					lineWidth : 2,	//线条宽度
					strokeStyle : "rgba(255, 50, 50, 0.1)"	//颜色透明度等等
				}
			});
			/** * mapv一般轨迹接口end ** */

		},
datas数据结构:List
public List getMapvList(Map map_in) {
		long enterTime = System.currentTimeMillis();
		List list = new ArrayList();

		try {
			List list_sql = mapRecordPathMapper.getMapv(map_in);
			writeObject(list_sql);

			String[] lngs, lats;
			double[][] geos;
			int i = 0;

			Iterator itor = list_sql.iterator();
			while (itor.hasNext()) {
				Map m = (Map) itor.next();
				lngs = ((String)m.get("lngs")).split(",");
				lats = ((String)m.get("lats")).split(",");
				geos = new double[lats.length][2];
				for (i = 0; i < lats.length; i++) {
					geos[i] = GpsToBaidu.wgs2bd(Double.parseDouble(lngs[i]), Double.parseDouble(lats[i]));
				}

				m.clear();
				m.put("geo", geos);
				m.put("count", "1");
				list.add(m);
			}

		} catch (Exception e) {
			e.printStackTrace();
		}

		long leaveTime = System.currentTimeMillis();
		System.err.println("轨迹图数据处理用时:" + (leaveTime - enterTime) / 1000.00 + "秒");
		return list;
	}
最后说一点,一般行车仪取到的坐标是gps坐标,要在百度地图上比较精确的展示得转为百度坐标,这里提供一个精度较高的转换方法:
public class GpsToBaidu {

	public static double pi = 3.1415926535897932384626;
	public static double ee = 0.00669342162296594323;
	public static double a = 6378245.0;
	public static double lon;
	public static double lat;

	public static void gps84_To_Gcj02() {
		double dLat = transformLat(lon - 105.0, lat - 35.0);
		double dLon = transformLon(lon - 105.0, lat - 35.0);
		double radLat = lat / 180.0 * pi;
		double magic = Math.sin(radLat);
		magic = 1 - ee * magic * magic;
		double sqrtMagic = Math.sqrt(magic);
		dLat = (dLat * 180.0) / ((a * (1 - ee)) / (magic * sqrtMagic) * pi);
		dLon = (dLon * 180.0) / (a / sqrtMagic * Math.cos(radLat) * pi);
		lat = lat + dLat;
		lon = lon + dLon;
	}

	public static void gcj02_To_Bd09() {
		double x = lon, y = lat;
		double z = Math.sqrt(x * x + y * y) + 0.00002 * Math.sin(y * pi);
		double theta = Math.atan2(y, x) + 0.000003 * Math.cos(x * pi);
		lon = z * Math.cos(theta) + 0.0065;
		lat = z * Math.sin(theta) + 0.006;
	}

	// 函数功能:纬度转换
	public static double transformLat(double x, double y) {
		double ret = -100.0 + 2.0 * x + 3.0 * y + 0.2 * y * y + 0.1 * x * y + 0.2 * Math.sqrt(Math.abs(x));
		ret += (20.0 * Math.sin(6.0 * x * pi) + 20.0 * Math.sin(2.0 * x * pi)) * 2.0 / 3.0;
		ret += (20.0 * Math.sin(y * pi) + 40.0 * Math.sin(y / 3.0 * pi)) * 2.0 / 3.0;
		ret += (160.0 * Math.sin(y / 12.0 * pi) + 320 * Math.sin(y * pi / 30.0)) * 2.0 / 3.0;
		return ret;
	}

	// 函数功能:经度转换
	public static double transformLon(double x, double y) {
		double ret = 300.0 + x + 2.0 * y + 0.1 * x * x + 0.1 * x * y + 0.1 * Math.sqrt(Math.abs(x));
		ret += (20.0 * Math.sin(6.0 * x * pi) + 20.0 * Math.sin(2.0 * x * pi)) * 2.0 / 3.0;
		ret += (20.0 * Math.sin(x * pi) + 40.0 * Math.sin(x / 3.0 * pi)) * 2.0 / 3.0;
		ret += (150.0 * Math.sin(x / 12.0 * pi) + 300.0 * Math.sin(x / 30.0 * pi)) * 2.0 / 3.0;
		return ret;
	}

	public static double[] wgs2bd(double in_lon, double in_lat) {
		lon = in_lon;
		lat = in_lat;
		GpsToBaidu.gps84_To_Gcj02();
		GpsToBaidu.gcj02_To_Bd09();
		double[] gcj2bd = { lon, lat };
		return gcj2bd;
	}

	public static void main(String[] args) {
		double in_lon = 118.50918;
		double in_lat = 35.54187;
		double[] aaa = GpsToBaidu.wgs2bd(in_lon, in_lat);
		System.err.println(aaa[0] + "," + aaa[1]);
	}

}
就这些了。
补充一下,做海量点的轨迹效果时,网络传输速度会是很大的问题。
比如600W个点,转成json后大小也有十几兆,按照100KB(我测试用的阿里云主机1M网速)的网速算,得100多秒才能完成服务器到js的传输过程。这在客户使用时是难以接受的。而且600万个点仅仅是两个小城市一天的数据,如果是更大范围的数据则更难相像了。
所以目前看来baidu map或者 mapv要处理大量的轨迹还是有难度的,总结一下目前主要的问题:
1、点数量上十万时,调用百度地图展示时就会有明显的缓慢,这应该是覆盖物太多导致的。
2、数据量太大时,存在的网络传输速度问题。
后话,时间2020-01-08,因为老是要手机验证很久没上csdn,统一回复一下。源码给不了是当初给前公司做的项目,有版权。核心代码、开源技术上文都写了,主要是百度地图的热力图api及mapv插件的轨迹图。
现在2020年,技术也在进步了,在这方面我可以提供一些我的经验。对于行车轨迹的处理,热力图及轨迹图的成型技术:
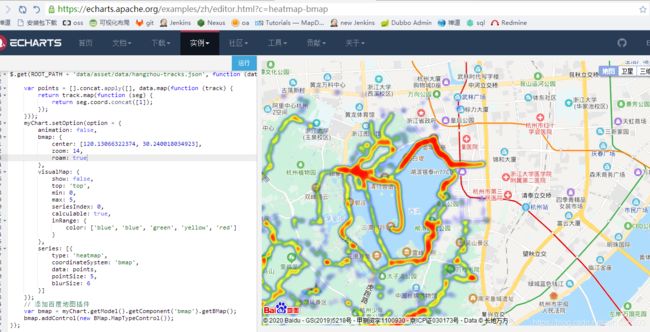
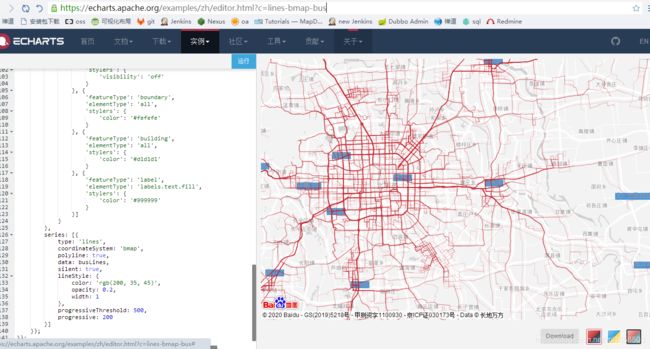
1、简单快速开发部署,可以试试echarts,直接兼容baidumap,成型控件。
热力图:https://echarts.apache.org/examples/zh/editor.html?c=heatmap-bmap
轨迹图:https://echarts.apache.org/examples/zh/editor.html?c=lines-bmap-bus
如果链接失效可以去echart2官网找。
2、想自己维护自由度和要求条件更高的热力图及轨迹图,自己研究百度地图热力图及mapv的api,现在mapv也发展了,有了更多的控件选择。但是开发工作量肯定是有的:
mapv项目demo示例:https://mapv.baidu.com/examples/
不过看来性能问题还是没解决,才150万个点就卡死了。我当年测试好歹是拿的600万个点。。。
3、对数据量和性能有非常高要求的,要不问问阿里和高德地图有没有成型的解决方案。
无论哪一种,前提都得要自己对map提供api有一定的学习了解,源码只能解决当前的问题。
最后,学海无涯,与君共勉。
