量化投资学习笔记12——时间序列分析实操
还是宅在家里,继续学习。
用真实的股票数据来实践一下刚学的时间序列分析的内容吧。分析一下我定投的两支股票:300etf(510300),纳指etf(513100)。
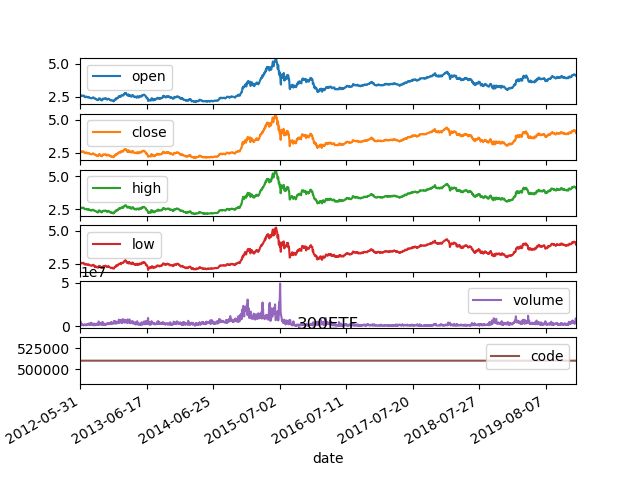
首先用tushare下载股价数据,时间范围从其创立到2020年1月31日。然后将数据处理后存入csv文件,再把下载数据的代码注释掉,以后直接从文件读取数据就行了。详细代码见我的github项目页面,就不列出来了。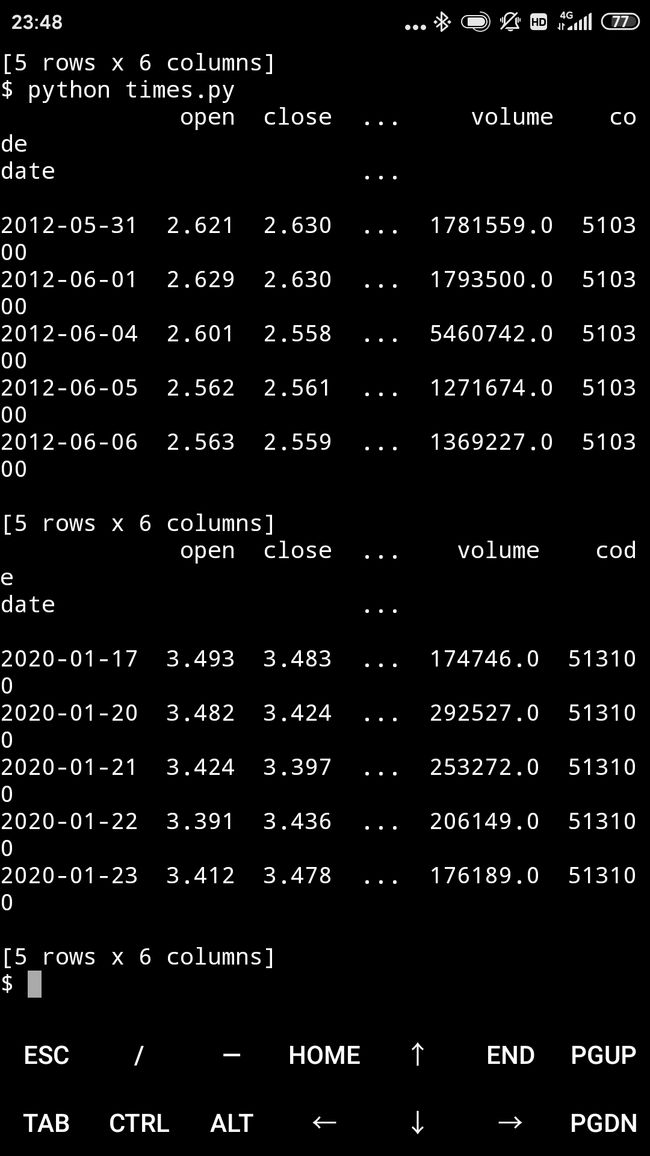
用重采样的方法来画月线
重采样 画月线
fig = plt.figure()
df_300["close"].resample("M").mean().plot(legend = True)
plt.savefig("300ETF_month.png")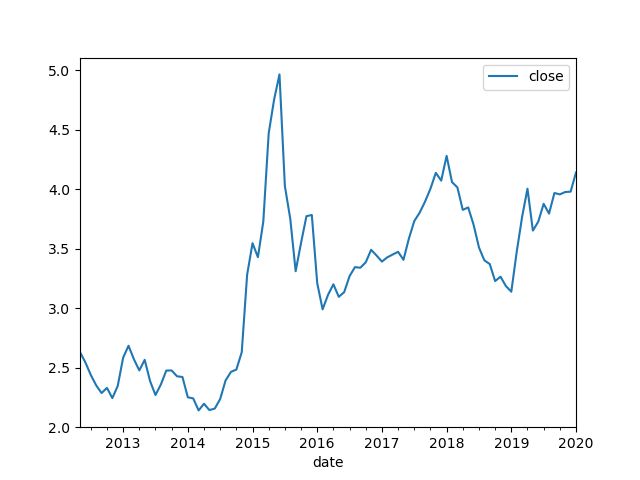
接下来进行一些统计分析
每天的涨跌幅
用"df_300.close.div(df_300.close.shift(1))"就可以生成明天的涨跌幅比例,再画出来。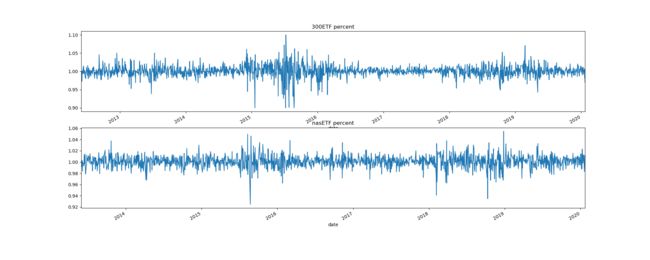
计算收益率,用df_300["returns"] = df_300.close.pct_change().mul(100)
计算相继列的绝对差值
df_300.close.diff()
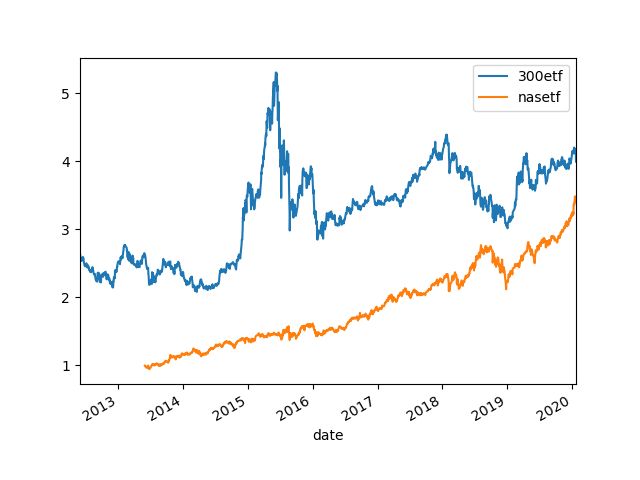
由于股价不一样,时间起点也不一样,不方便比较。将两个股价正态化,从同一时间起点比较。
df_300_cut = df_300.close["2013-05-31":]
norm_300 = df_300_cut.div(df_300_cut.iloc[0]).mul(100)
norm_nas = df_nas.close.div(df_nas.close.iloc[0]).mul(100)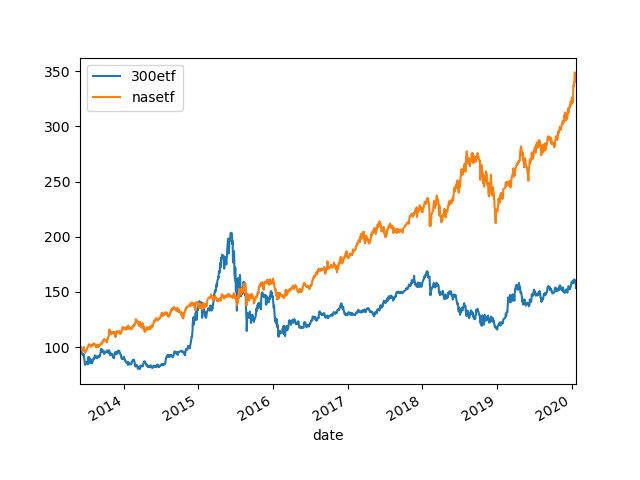
可见两个股市还是蛮不一样的,美股买入持有就行了,A股就不行,坐过山车。
下面来画窗口函数,有两种,一种是rolling窗口函数,其切片大小是固定的,也就是我们常用的均线。
rolling_300 = df_300.close.rolling("90D").mean()
画出来看看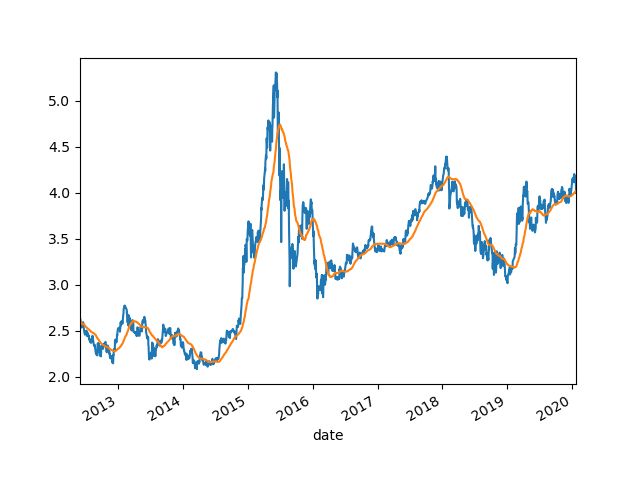
还有一种是expanding窗口函数,指把之前的所有数据都计算进来,是累积值。
expanding_300 = df_300.close.expanding().mean()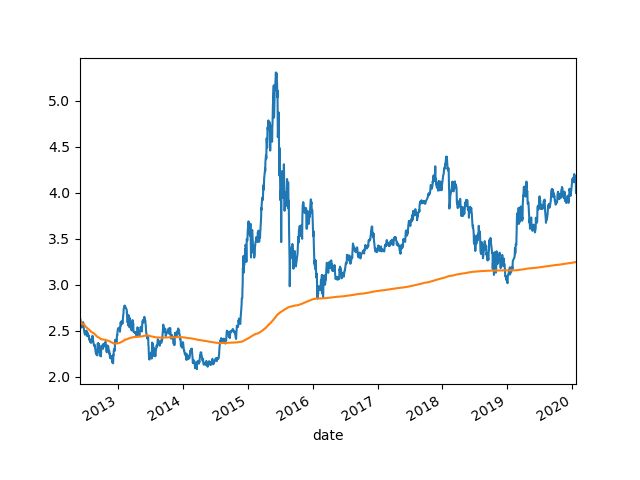
貌似可以用来当做历史大底,尤其是A股。
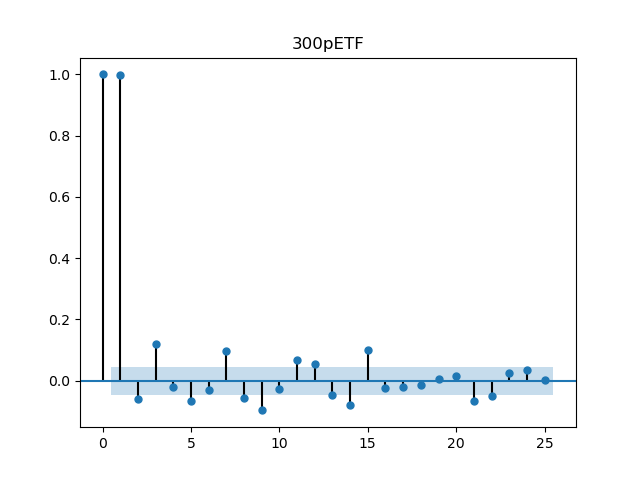
来看序列的自相关性和部分自相关性,用statsmodels.graphics.tsaplots里的plot_acf函数和plot_pacf函数。
plot_acf(df_300["close"], lags = 25, title = "300ETF")
plot_pacf(df_300["close"], lags = 25, title = "300pETF")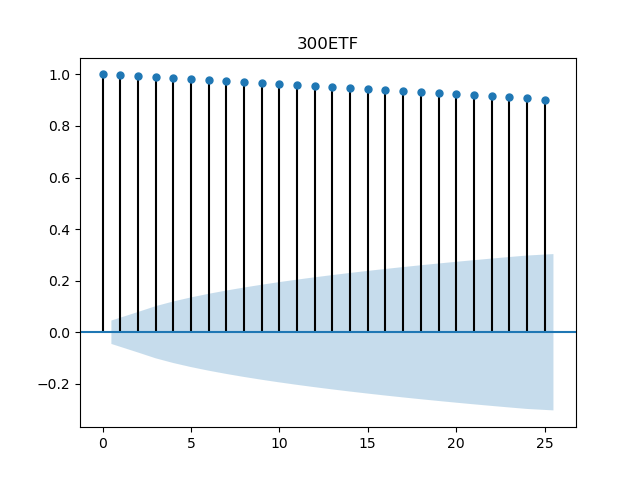
对于部分自相关性,只有小部分时点位于置信区间以外。
数据趋势的分解,我的理解就是将数据序列分解为周期性的部分和非周期的部分,用
decomposed_300 = sm.tsa.seasonal_decompose(df_300["close"], freq = 360)
从两图中可以看出,剔除了周期性因素,A股有明显的波动性,而美股则是一直向上的趋势。
看序列是否为随机行走序列,用单位根检验的方法。具体为statsmodels.tsa.stattools里的adfuller函数。
adf_300 = adfuller(df_300["close"])
print("300etf的单位根检验p值=%lf" % adf_300[1])
输出结果为
300etf的单位根检验p值=0.288299
NASetf的单位根检验p值=0.997857
二者结果均大于0.05,差异无统计学意义,两个序列均为随机行走序列。
再看看稳定性,就是画图啦,另外还画了序列的一阶差分。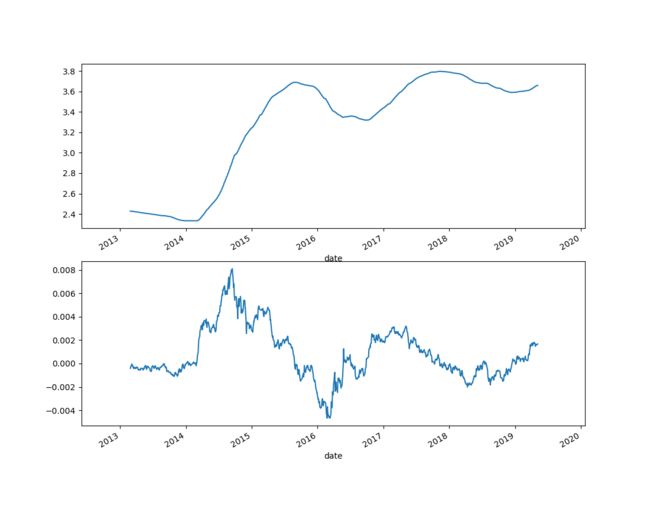
以上就是时间序列的统计描述部分,接下来就用各种模型对数据进行预测啦。
先用AR模型,具体解释见上一篇博文吧。
from statsmodels.tsa.arima_model import ARMA
df300_model = ARMA(df_300["close"].diff().iloc[1:].values, order = (1, 0))
df300_res = df300_model.fit()
fig = plt.figure()
fig = df300_res.plot_predict(start = 1000, end = 1100)
fig.savefig("arma_300.png")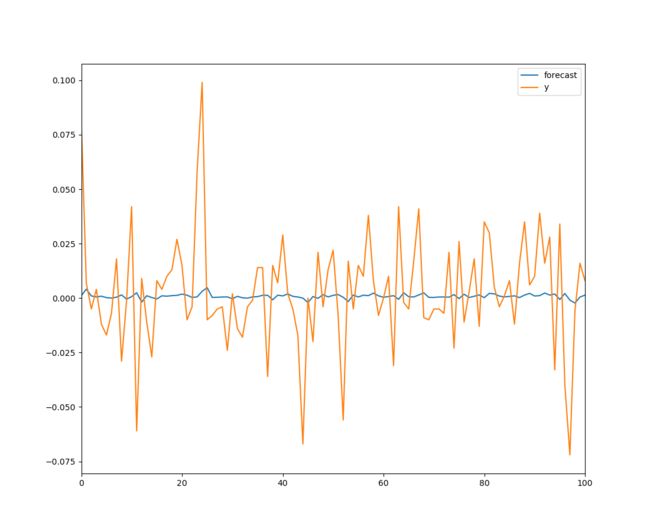
模型预测能力很弱。
ARMA模型
df300_ma = ARMA(df_300["close"].diff().iloc[1:].values, order = (0, 1))
就是order那里是(0, 1),其它跟前面一样。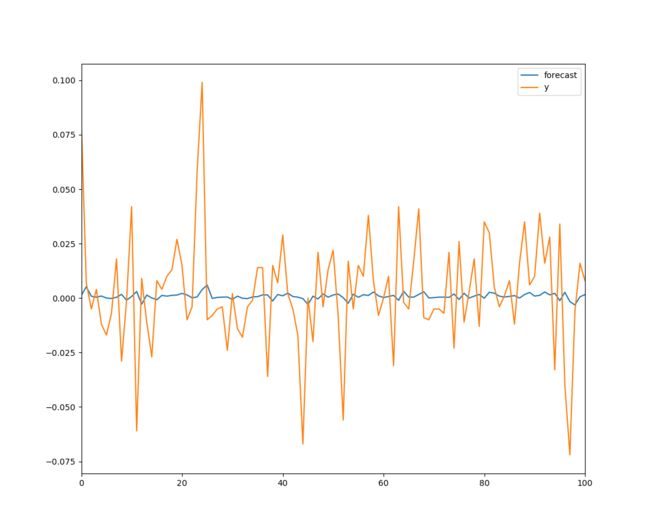
ARMA模型
df300_arma = ARMA(df_300["close"].diff().iloc[1:].values, order = (3, 3))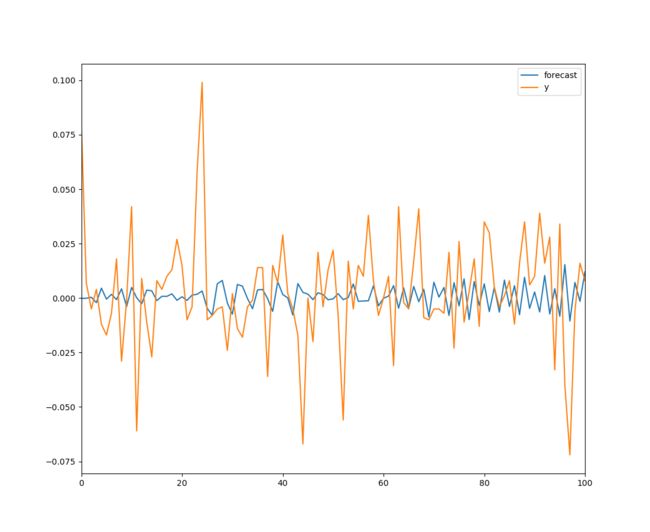
好一点,但是也没好多少。
ARIMA模型
from statsmodels.tsa.arima_model import ARIMA
df300_arima = ARIMA(df_300["close"].diff().iloc[1:].values, order = (2, 1, 0))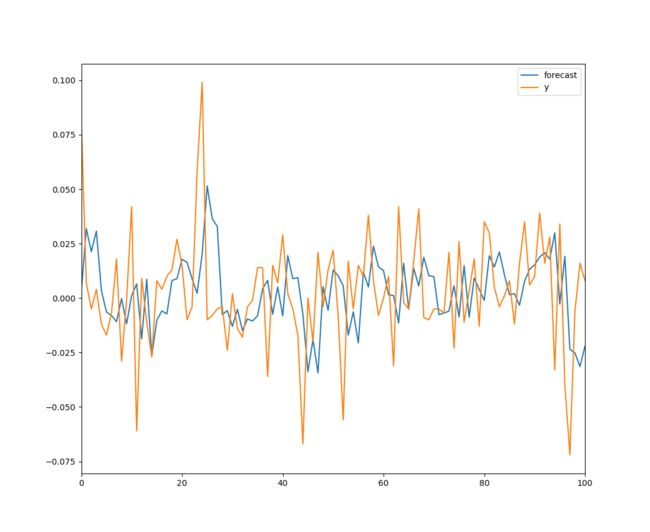
预测结果好了很多,只是有延迟。
VAR模型,要用两个序列。
train_sample = pd.concat([norm_300.diff().iloc[1:], norm_nas.diff().iloc[1:]], axis = 1)
model = sm.tsa.VARMAX(train_sample, order = (2, 1), trend = "c")
result = model.fit(maxiter = 1000, disp = True)
print(result.summary())
fig = result.plot_diagnostics()
fig.savefig("var_dio.png")
pre_res = result.predict(start = 1000, end = 1100)
fig = plt.figure()
plt.plot(pre_res)
fig.savefig("var_pre.png")
SARIMA模型
train_sample = df_300["close"].diff().iloc[1:].values
model = sm.tsa.SARIMAX(train_sample, order = (4, 0, 4), trend = "c")
result = model.fit(maxiter = 1000, disp = True)
print(result.summary())
fig = plt.figure()
plt.plot(train_sample[1:600], color = "red")
plt.plot(result.predict(start = 0, end = 600), color = "blue")
fig.savefig("SARIMA.png")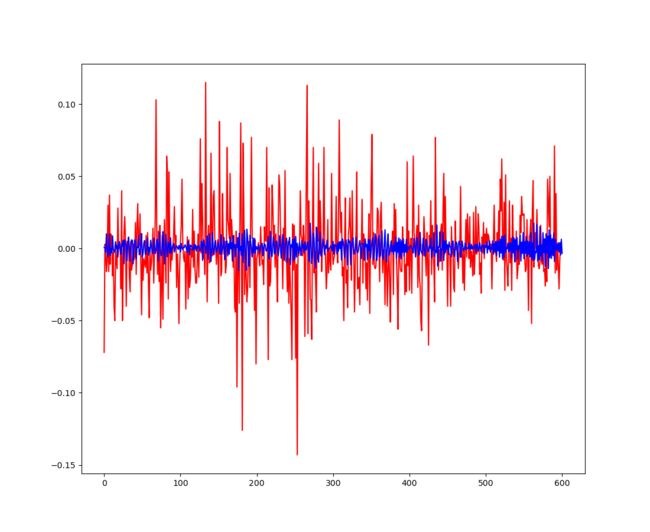
未观察成分模型
model = sm.tsa.UnobservedComponents(train_sample, "local level")
result = model.fit(maxiter = 1000, disp = True)
print(result.summary())
fig = plt.figure()
plt.plot(train_sample[1:600], color = "red")
plt.plot(result.predict(start = 0, end = 600), color = "blue")
fig.savefig("unobserve.png")
最后一个模型:动态因子模型
train_sample = pd.concat([norm_300.diff().iloc[1:], norm_nas.diff().iloc[1:]], axis = 1)
model = sm.tsa.DynamicFactor(train_sample, k_factors = 1, factor_order = 2)
result = model.fit(maxiter = 1000, disp = True)
print(result.summary())
predicted_result = result.predict(start = 0, end = 1000)
fig = plt.figure()
plt.plot(train_sample[:500], color = "red")
plt.plot(predicted_result[:500], color = "blue")
fig.savefig("dfmodel.png")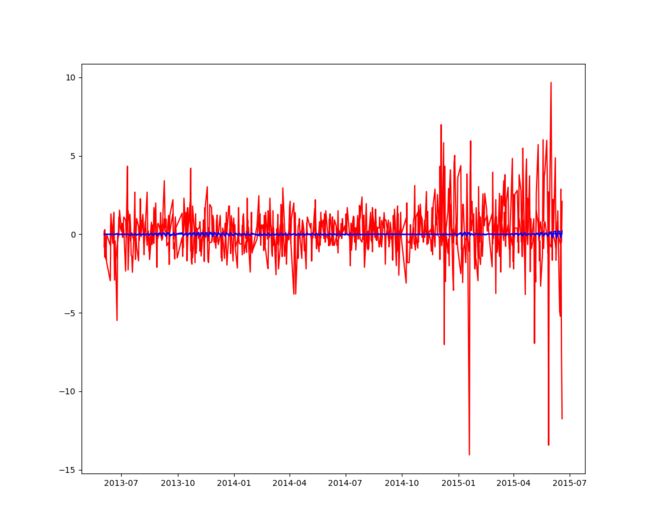
貌似这些模型对预测股市效果都一般。再看看其它方法吧。
我发文章的四个地方,欢迎大家在朋友圈等地方分享,欢迎点“在看”。
我的个人博客地址:https://zwdnet.github.io
我的知乎文章地址: https://www.zhihu.com/people/zhao-you-min/posts
我的博客园博客地址: https://www.cnblogs.com/zwdnet/
我的微信个人订阅号:赵瑜敏的口腔医学学习园地
