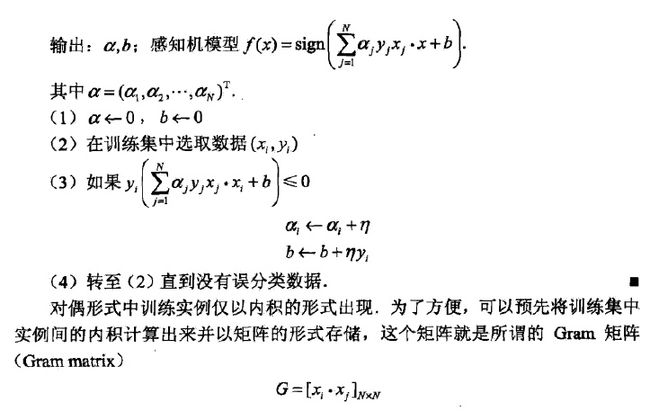
- # -*- coding:utf-8 -*-
- # Filename: train2.2.py
- # Author:hankcs
- # Date: 2015/1/31 15:15
- import numpy as np
- from matplotlib import pyplot as plt
- from matplotlib import animation
-
- training_set = np.array([[[3, 3], 1], [[4, 3], 1], [[1, 1], -1], [[5, 2], -1]]) #训练样本
-
- a = np.zeros(len(training_set), np.float) #矩阵a的长度为训练集样本数,类型为float
- b = 0.0 #参数初始值为0
- Gram = None #Gram矩阵
- y = np.array(training_set[:, 1]) #y=[1 1 -1 -1]
- x = np.empty((len(training_set), 2), np.float) #x为4*2的矩阵
- for i in range(len(training_set)): #x=[[3., 3.], [4., 3.], [1., 1.], [5., 2.]]
- x[i] = training_set[i][0]
- history = [] #history记录每次迭代结果
-
- def cal_gram():
- """
- 计算Gram矩阵
- :return:
- """
- g = np.empty((len(training_set), len(training_set)), np.int)
- for i in range(len(training_set)):
- for j in range(len(training_set)):
- g[i][j] = np.dot(training_set[i][0], training_set[j][0]) #G=[xi*xj]
- return g
-
-
- def update(i):
- """
- 随机梯度下降更新参数
- :param i:
- :return:
- """
- global a, b
- a[i] += 1 #根据误分类点更新参数
- b = b + 1 * y[i] #这里1是学习效率η
- history.append([np.dot(a * y, x), b]) #history记录每次迭代结果
- print a, b #输出每次迭代结果
-
-
- #计算yi(Gram*xi+b),用来判断是否是误分类点
- def cal(i):
- global a, b, x, y
- res = np.dot(a * y, Gram[i])
- res = (res + b) * y[i] #返回
- return res
-
-
- #检查是否已经正确分类
- def check():
- global a, b, x, y
- flag = False
- for i in range(len(training_set)): #遍历每个点
- if cal(i) <= 0: #如果yi(Gram*xi+b)<=0.则是误分类点
- flag = True
- update(i) #用误分类点更新参数
- if not flag: #如果已正确分类
- w = np.dot(a * y, x) #计算w
- print "RESULT: w: " + str(w) + " b:" + str(b) #输出最后结果
- return False
- return True
-
-
- if __name__ == "__main__":
- Gram = cal_gram() #初始化 Gram矩阵
- for i in range(1000): #迭代1000次
- if not check(): break #如果已正确分类则结束循环
-
- #以下代码是将迭代过程可视化,数据来源于history
- # first set up the figure, the axis, and the plotelement we want to animate
- fig = plt.figure()
- ax = plt.axes(xlim=(0, 2), ylim=(-2, 2))
- line, = ax.plot([], [], 'g', lw=2)
- label = ax.text([], [], '')
-
- # initialization function: plot the background of eachframe
- def init():
- line.set_data([], [])
- x, y, x_, y_ = [], [], [], []
- for p in training_set:
- if p[1] > 0:
- x.append(p[0][0])
- y.append(p[0][1])
- else:
- x_.append(p[0][0])
- y_.append(p[0][1])
-
- plt.plot(x, y, 'bo', x_, y_, 'rx')
- plt.axis([-6, 6, -6, 6])
- plt.grid(True)
- plt.xlabel('x')
- plt.ylabel('y')
- plt.title('PerceptronAlgorithm 2 (www.hankcs.com)')
- return line, label
-
-
- # animation function. this is called sequentially
- def animate(i):
- global history, ax, line, label
-
- w = history[i][0]
- b = history[i][1]
- if w[1] == 0: return line, label
- x1 = -7.0
- y1 = -(b + w[0] * x1) / w[1]
- x2 = 7.0
- y2 = -(b + w[0] * x2) / w[1]
- line.set_data([x1, x2], [y1, y2])
- x1 = 0.0
- y1 = -(b + w[0] * x1) / w[1]
- label.set_text(str(history[i][0]) + ' ' + str(b))
- label.set_position([x1, y1])
- return line, label
-
- # call the animator. blit=true means only re-draw the parts that have changed.
- anim =animation.FuncAnimation(fig, animate, init_func=init, frames=len(history), interval=1000, repeat=True,
- blit=True)
- plt.show()
- #anim.save('D:/perceptron2.gif',fps=2, writer='imagemagick')
|

![]() ,这里
,这里![]() ,则最终求解到的参数分别表示为:
,则最终求解到的参数分别表示为:

