Ame房价回归-top10%方案
数据介绍
数据来源于kaggle House Prices
数据有以下几个维度,其中36个为特征,价格为标签
| 特征 | 定义 |
|---|---|
| SalePrice | 物业的销售价格以美元计算。这是您尝试预测的目标变量。 |
| MSSubClass | 建筑类 |
| MSZoning | 一般分区分类 |
| LotFrontage | 街道的线性脚连接到财产 |
| LotArea | 地块尺寸,平方英尺 |
| Street | 道路通道的类型 |
| Alley | 胡同通道的类型 |
| LotShape | 一般的财产形状 |
| LandContour | 物业的平整度 |
| Utilities | 可用的实用程序类型 |
| LotConfig | 批量配置 |
| LandSlope | 物业坡度 |
| Neighborhood: | Ames市区内的物理位置 |
| Condition1 | 靠近主要道路或铁路 |
| Condition2 | 靠近主要道路或铁路(如果存在第二个) |
| BldgType | 住宅类型 |
| HouseStyle | 住宅风格 |
| OverallQual | 整体材料和成品质量 |
| OverallCond | 总体状况评级 |
| YearBuilt | 原始施工日期 |
| YearRemodAdd | 改造日期 |
| RoofStyle | 屋顶类型 |
| RoofMatl | 屋顶材料 |
| Exterior1st | 房屋外墙 |
| Exterior2nd | 房屋外墙(如果有多种材料) |
| MasVnrType | 砌体贴面类型 |
| MasVnrArea | 平方英尺的砌体饰面区域 |
| ExterQual | 外部材料质量 |
| ExterCond | 外部材料的现状 |
| Foundation | 基础类型 |
| BsmtQual | 地下室的高度 |
| BsmtCond | 地下室的一般情况 |
| BsmtExposure | 罢工或花园层地下室墙壁 |
| BsmtFinType1 | 地下室成品区的质量 |
| BsmtFinSF1 | 类型1完成平方英尺 |
| BsmtFinType2 | 第二个完成区域的质量(如果存在) |
| BsmtFinSF2 | 2型成品平方英尺 |
| BsmtUnfSF | 未完成的地下室平方英尺 |
| TotalBsmtSF | 地下室总面积 |
| Heating | 加热类型 |
| HeatingQC | 加热质量和条件 |
| CentralAir | 中央空调 |
| Electrical | 电气系统 |
| 1stFlrSF | 一楼平方英尺 |
| 2ndFlrSF | 二楼平方英尺 |
| LowQualFinSF | 低质量的平方英尺(所有楼层) |
| GrLivArea | 以上(地面)生活区平方英尺 |
| BsmtFullBath | 地下室齐全的浴室 |
| BsmtHalfBath | 地下室半浴室 |
| FullBath | 满级以上的浴室 |
| HalfBath | 半年级以上 |
| Bedroom | 地下室以上的卧室数量 |
| Kitchen | 厨房数量 |
| KitchenQual | 厨房质量 |
| TotRmsAbvGrd | 以上级别的房间总数(不包括浴室) |
| Functional | 家庭功能评级 |
| Fireplaces | 壁炉数量 |
| FireplaceQu | 壁炉质量 |
| GarageType | 车库位置 |
| GarageYrBlt | 年车库建成 |
| GarageFinish | 车库的内部装饰 |
| GarageCars | 车库容量的车库大小 |
| GarageArea | 车库的面积,平方英尺 |
| GarageQual | 车库质量 |
| GarageCond | 车库状况 |
| PavedDrive | 铺好的车道 |
| WoodDeckSF | 平方英尺的木甲板面积 |
| OpenPorchSF | 平方英尺的开放式门廊区域 |
| EnclosedPorch | 封闭的门廊面积,平方英尺 |
| 3SsnPorch | 三个季节的门廊面积,平方英尺 |
| ScreenPorch | 屏幕门廊面积,平方英尺 |
| PoolArea | 泳池面积,平方英尺 |
| PoolQC | 泳池质量 |
| Fence | 栅栏质量 |
| MiscFeature | 其他类别未涵盖的其他功能 |
| MiscVal | 杂项功能的价值 |
| MoSold | 已售出月份 |
| YrSold | 已售出年份 |
| SaleType | 销售类型 |
| SaleCondition | 销售条件 |
读取数据
import numpy as np
import pandas as pd
import matplotlib.pyplot as plt
import seaborn as sns
from scipy import stats
from scipy.stats import norm, skew
train=pd.read_csv('train.csv')
test=pd.read_csv('test.csv')
train.shape,test.shape
((1460, 81), (1459, 80))
train.describe()
| Id | MSSubClass | LotFrontage | LotArea | OverallQual | OverallCond | YearBuilt | YearRemodAdd | MasVnrArea | BsmtFinSF1 | ... | WoodDeckSF | OpenPorchSF | EnclosedPorch | 3SsnPorch | ScreenPorch | PoolArea | MiscVal | MoSold | YrSold | SalePrice | |
|---|---|---|---|---|---|---|---|---|---|---|---|---|---|---|---|---|---|---|---|---|---|
| count | 1460.000000 | 1460.000000 | 1201.000000 | 1460.000000 | 1460.000000 | 1460.000000 | 1460.000000 | 1460.000000 | 1452.000000 | 1460.000000 | ... | 1460.000000 | 1460.000000 | 1460.000000 | 1460.000000 | 1460.000000 | 1460.000000 | 1460.000000 | 1460.000000 | 1460.000000 | 1460.000000 |
| mean | 730.500000 | 56.897260 | 70.049958 | 10516.828082 | 6.099315 | 5.575342 | 1971.267808 | 1984.865753 | 103.685262 | 443.639726 | ... | 94.244521 | 46.660274 | 21.954110 | 3.409589 | 15.060959 | 2.758904 | 43.489041 | 6.321918 | 2007.815753 | 180921.195890 |
| std | 421.610009 | 42.300571 | 24.284752 | 9981.264932 | 1.382997 | 1.112799 | 30.202904 | 20.645407 | 181.066207 | 456.098091 | ... | 125.338794 | 66.256028 | 61.119149 | 29.317331 | 55.757415 | 40.177307 | 496.123024 | 2.703626 | 1.328095 | 79442.502883 |
| min | 1.000000 | 20.000000 | 21.000000 | 1300.000000 | 1.000000 | 1.000000 | 1872.000000 | 1950.000000 | 0.000000 | 0.000000 | ... | 0.000000 | 0.000000 | 0.000000 | 0.000000 | 0.000000 | 0.000000 | 0.000000 | 1.000000 | 2006.000000 | 34900.000000 |
| 25% | 365.750000 | 20.000000 | 59.000000 | 7553.500000 | 5.000000 | 5.000000 | 1954.000000 | 1967.000000 | 0.000000 | 0.000000 | ... | 0.000000 | 0.000000 | 0.000000 | 0.000000 | 0.000000 | 0.000000 | 0.000000 | 5.000000 | 2007.000000 | 129975.000000 |
| 50% | 730.500000 | 50.000000 | 69.000000 | 9478.500000 | 6.000000 | 5.000000 | 1973.000000 | 1994.000000 | 0.000000 | 383.500000 | ... | 0.000000 | 25.000000 | 0.000000 | 0.000000 | 0.000000 | 0.000000 | 0.000000 | 6.000000 | 2008.000000 | 163000.000000 |
| 75% | 1095.250000 | 70.000000 | 80.000000 | 11601.500000 | 7.000000 | 6.000000 | 2000.000000 | 2004.000000 | 166.000000 | 712.250000 | ... | 168.000000 | 68.000000 | 0.000000 | 0.000000 | 0.000000 | 0.000000 | 0.000000 | 8.000000 | 2009.000000 | 214000.000000 |
| max | 1460.000000 | 190.000000 | 313.000000 | 215245.000000 | 10.000000 | 9.000000 | 2010.000000 | 2010.000000 | 1600.000000 | 5644.000000 | ... | 857.000000 | 547.000000 | 552.000000 | 508.000000 | 480.000000 | 738.000000 | 15500.000000 | 12.000000 | 2010.000000 | 755000.000000 |
8 rows × 38 columns
将test的Id单独保存,train和test的Id删除
testid=test['Id']
train=train.drop('Id',axis=1)
test=test.drop('Id',1)
特征工程
观察数据分布
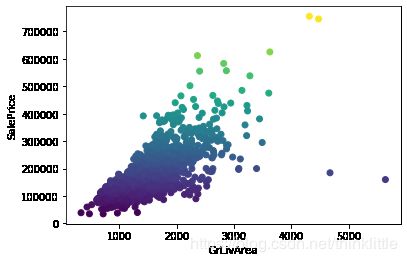
地面以上生活面积和价格的关系
在购置房屋时候,一个影响房屋的关键因素就是房屋的面积,那么,可以从房屋面积开始探索
# 将价格作为着色的标准,绘制散点图
plt.scatter(train['GrLivArea'],train['SalePrice'],c=train['SalePrice'])
plt.xlabel('GrLivArea')
plt.ylabel('SalePrice')
plt.show()
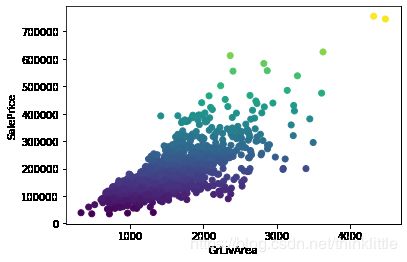
显然,存在2个异常值点(价格低于30k,面积大于4000),可以直接剔除,这对模型的拟合不会产生不好的影响
train = train.drop(train[(train['GrLivArea']>4000) & (train['SalePrice']<300000)].index)
plt.scatter(train['GrLivArea'],train['SalePrice'],c=train['SalePrice'])
plt.xlabel('GrLivArea')
plt.ylabel('SalePrice')
plt.show()
房价的总趋势
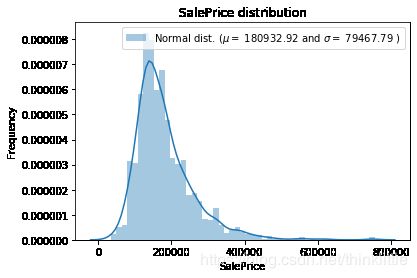
通过绘制房价的趋势图,观察房价的分布
from scipy.stats import norm, skew
# 并绘制其概率密度曲线
sns.distplot(train['SalePrice'])
(mu, sigma) = norm.fit(train['SalePrice'])
plt.legend(['Normal dist. ($\mu=$ {:.2f} and $\sigma=$ {:.2f} )'.format(mu, sigma)],
            loc='best')
plt.ylabel('Frequency')
plt.title('SalePrice distribution')
plt.show()
scipy.norm是指概率密度函数: f ( x ) = e x 2 / 2 x ⋅ π f(x)=\frac{e^{x^2/2}}{ \sqrt{x} \cdot \pi} f(x)=x⋅πex2/2
scipy.skew是指偏度: g 1 = m 3 m 2 3 / 2 g_1=\frac{m_3}{m_2^{3/2}} g1=m23/2m3
m i = 1 N ∑ n = 1 N ( x n − x ˉ ) i m_i=\frac{1}{N}\sum_{n=1}^N (x_n-\bar x)^i mi=N1n=1∑N(xn−xˉ)i
# 绘制qq图
stats.probplot(train['SalePrice'], plot=plt)
plt.title('Q-Q plot')
plt.show()
合并数据集
target=train['SalePrice']
train=train.drop('SalePrice',axis=1)
full= pd.concat((train, test))
full.head()
| MSSubClass | MSZoning | LotFrontage | LotArea | Street | Alley | LotShape | LandContour | Utilities | LotConfig | ... | ScreenPorch | PoolArea | PoolQC | Fence | MiscFeature | MiscVal | MoSold | YrSold | SaleType | SaleCondition | |
|---|---|---|---|---|---|---|---|---|---|---|---|---|---|---|---|---|---|---|---|---|---|
| 0 | 60 | RL | 65.0 | 8450 | Pave | NaN | Reg | Lvl | AllPub | Inside | ... | 0 | 0 | NaN | NaN | NaN | 0 | 2 | 2008 | WD | Normal |
| 1 | 20 | RL | 80.0 | 9600 | Pave | NaN | Reg | Lvl | AllPub | FR2 | ... | 0 | 0 | NaN | NaN | NaN | 0 | 5 | 2007 | WD | Normal |
| 2 | 60 | RL | 68.0 | 11250 | Pave | NaN | IR1 | Lvl | AllPub | Inside | ... | 0 | 0 | NaN | NaN | NaN | 0 | 9 | 2008 | WD | Normal |
| 3 | 70 | RL | 60.0 | 9550 | Pave | NaN | IR1 | Lvl | AllPub | Corner | ... | 0 | 0 | NaN | NaN | NaN | 0 | 2 | 2006 | WD | Abnorml |
| 4 | 60 | RL | 84.0 | 14260 | Pave | NaN | IR1 | Lvl | AllPub | FR2 | ... | 0 | 0 | NaN | NaN | NaN | 0 | 12 | 2008 | WD | Normal |
5 rows × 79 columns
处理缺失值
# 计算缺失率
full_na = (full.isnull().sum() / len(full)) * 100
# 将缺失率为0的删除,并对缺失率进行降序排列截取前30个
full_na = full_na.drop(full_na[full_na == 0].index).sort_values(ascending=False)[:30]
missing_data = pd.DataFrame({'Missing Ratio' :full_na})
missing_data.head()
| Missing Ratio | |
|---|---|
| PoolQC | 99.691464 |
| MiscFeature | 96.400411 |
| Alley | 93.212204 |
| Fence | 80.425094 |
| FireplaceQu | 48.680151 |
f, ax = plt.subplots(figsize=(15, 12))
plt.xticks(rotation='90')
sns.barplot(x=full_na.index, y=full_na)
plt.xlabel('Features', fontsize=15)
plt.ylabel('Percent of missing values', fontsize=15)
plt.title('Percent missing data by feature', fontsize=15)
plt.show()
绘制train的热力图
corrmat = train.corr()
plt.subplots(figsize=(12,9))
sns.heatmap(corrmat, vmax=0.9, square=True)
缺失值处理
full.info()
Int64Index: 2917 entries, 0 to 1458
Data columns (total 79 columns):
MSSubClass       2917 non-null int64
MSZoning         2913 non-null object
LotFrontage      2431 non-null float64
LotArea          2917 non-null int64
Street           2917 non-null object
Alley            198 non-null object
LotShape         2917 non-null object
LandContour      2917 non-null object
Utilities        2915 non-null object
LotConfig        2917 non-null object
LandSlope        2917 non-null object
Neighborhood     2917 non-null object
Condition1       2917 non-null object
Condition2       2917 non-null object
BldgType         2917 non-null object
HouseStyle       2917 non-null object
OverallQual      2917 non-null int64
OverallCond      2917 non-null int64
YearBuilt        2917 non-null int64
YearRemodAdd     2917 non-null int64
RoofStyle        2917 non-null object
RoofMatl         2917 non-null object
Exterior1st      2916 non-null object
Exterior2nd      2916 non-null object
MasVnrType       2893 non-null object
MasVnrArea       2894 non-null float64
ExterQual        2917 non-null object
ExterCond        2917 non-null object
Foundation       2917 non-null object
BsmtQual         2836 non-null object
BsmtCond         2835 non-null object
BsmtExposure     2835 non-null object
BsmtFinType1     2838 non-null object
BsmtFinSF1       2916 non-null float64
BsmtFinType2     2837 non-null object
BsmtFinSF2       2916 non-null float64
BsmtUnfSF        2916 non-null float64
TotalBsmtSF      2916 non-null float64
Heating          2917 non-null object
HeatingQC        2917 non-null object
CentralAir       2917 non-null object
Electrical       2916 non-null object
1stFlrSF         2917 non-null int64
2ndFlrSF         2917 non-null int64
LowQualFinSF     2917 non-null int64
GrLivArea        2917 non-null int64
BsmtFullBath     2915 non-null float64
BsmtHalfBath     2915 non-null float64
FullBath         2917 non-null int64
HalfBath         2917 non-null int64
BedroomAbvGr     2917 non-null int64
KitchenAbvGr     2917 non-null int64
KitchenQual      2916 non-null object
TotRmsAbvGrd     2917 non-null int64
Functional       2915 non-null object
Fireplaces       2917 non-null int64
FireplaceQu      1497 non-null object
GarageType       2760 non-null object
GarageYrBlt      2758 non-null float64
GarageFinish     2758 non-null object
GarageCars       2916 non-null float64
GarageArea       2916 non-null float64
GarageQual       2758 non-null object
GarageCond       2758 non-null object
PavedDrive       2917 non-null object
WoodDeckSF       2917 non-null int64
OpenPorchSF      2917 non-null int64
EnclosedPorch    2917 non-null int64
3SsnPorch        2917 non-null int64
ScreenPorch      2917 non-null int64
PoolArea         2917 non-null int64
PoolQC           9 non-null object
Fence            571 non-null object
MiscFeature      105 non-null object
MiscVal          2917 non-null int64
MoSold           2917 non-null int64
YrSold           2917 non-null int64
SaleType         2916 non-null object
SaleCondition    2917 non-null object
dtypes: float64(11), int64(25), object(43)
memory usage: 1.8+ MB
对数值型数据采用0和中值填充;
对object型数据采用None和众数填充;
-
PoolQC中超过99%的数据都缺失了,可以将缺失值填充为None,意味着缺少游泳池,因为大多数房子没有游泳池 -
MiscFeature中也是存在超过95%的缺失值,处理方式同上 -
Alley、Fence、FireplaceQu处理方式同上
na_list=['PoolQC','MiscFeature','Alley' ,'Fence','FireplaceQu']
for i in na_list:
    full[i]=full[i].fillna('None')
LotFrontage: 由于每条与房产相连的街道的面积很可能与其附近的其他房屋面积相似,我们可以通过该社区的LotFrontage中值来填补缺失的值。
full.LotFrontage=full.groupby('Neighborhood')['LotFrontage'].transform(lambda x: x.fillna(x.median()))
GarageType, GarageFinish, GarageQual and GarageCond: 将缺失值替换为None
for col in ('GarageType', 'GarageFinish', 'GarageQual', 'GarageCond'):
    full[col] = full[col].fillna('None')
GarageYrBlt, GarageArea and GarageCars: 由于缺失值较少,且为没有车这中情况也确实存在,可以考虑将缺失值用0插补
for col in ('GarageYrBlt', 'GarageArea', 'GarageCars'):
    full[col] = full[col].fillna(0)
BsmtFinSF1, BsmtFinSF2, BsmtUnfSF, TotalBsmtSF, BsmtFullBath and BsmtHalfBath: 置为0意味着没有地下室
for col in ('BsmtFinSF1', 'BsmtFinSF2', 'BsmtUnfSF','TotalBsmtSF', 'BsmtFullBath', 'BsmtHalfBath'):
    full[col] = full[col].fillna(0)
BsmtQual, BsmtCond, BsmtExposure, BsmtFinType1 and BsmtFinType2: 置为None意味着没有地下室
for col in ('BsmtQual', 'BsmtCond', 'BsmtExposure', 'BsmtFinType1', 'BsmtFinType2'):
    full[col] = full[col].fillna('None')
MasVnrArea and MasVnrType: 面积是数值型,将其置为0,类型是字符串类型,将其置为None,这意味着这些房子没有砌石饰面
full["MasVnrType"] = full["MasVnrType"].fillna("None")
full["MasVnrArea"] = full["MasVnrArea"].fillna(0)
MSZoning (The general zoning classification): 可以考虑用其众数来进行填补
full['MSZoning'] = full['MSZoning'].fillna(full['MSZoning'].mode()[0])
- Utilities : 'AllPub’占2945个,仅有1个 'NoSeWa’和一个缺失值,没有太大的实际意义,可以考虑直接删除
full['Utilities'].describe()
count       2915
unique         2
top       AllPub
freq        2914
Name: Utilities, dtype: object
full['Utilities'].unique()
array(['AllPub', 'NoSeWa', nan], dtype=object)
full = full.drop(['Utilities'], axis=1)
Electrical、KitchenQual、Exterior1st、Exterior2nd、SaleType:可以直接用出现次数最多的插补
full[['Electrical','KitchenQual','Exterior1st','Exterior2nd','SaleType']].describe()
| Electrical | KitchenQual | Exterior1st | Exterior2nd | SaleType | |
|---|---|---|---|---|---|
| count | 2916 | 2916 | 2916 | 2916 | 2916 |
| unique | 5 | 4 | 15 | 16 | 9 |
| top | SBrkr | TA | VinylSd | VinylSd | WD |
| freq | 2669 | 1492 | 1025 | 1014 | 2525 |
for i in ['Electrical','KitchenQual','Exterior1st','Exterior2nd','SaleType']:
    full[i]=full[i].fillna(full[i].mode()[0])
MSSubClass: 置为None意味着没有等级
full['MSSubClass'] = full['MSSubClass'].fillna("None")
Functional:填充为typical
full["Functional"] = full["Functional"].fillna("Typical")
检查有没有缺失值
# 计算缺失率
full_na = (full.isnull().sum() / len(full)) * 100
# 将缺失率为0的删除,并对缺失率进行降序排列截取前30个
full_na = full_na.drop(full_na[full_na == 0].index).sort_values(ascending=False)[:30]
missing_data = pd.DataFrame({'Missing Ratio' :full_na})
missing_data.head()
| Missing Ratio |
|---|
数据转换
采用sklearn的LabelEncoder 方法将部分数值类型的数据转换为类别
for col in ['MSSubClass','OverallCond','YrSold','MoSold']:
    full[col]=full[col].astype('str')
from sklearn.preprocessing import LabelEncoder
cols = ['FireplaceQu', 'BsmtQual', 'BsmtCond', 'GarageQual', 'GarageCond',
        'ExterQual', 'ExterCond','HeatingQC', 'PoolQC', 'KitchenQual', 'BsmtFinType1',
        'BsmtFinType2', 'Functional', 'Fence', 'BsmtExposure', 'GarageFinish', 'LandSlope',
        'LotShape', 'PavedDrive', 'Street', 'Alley', 'CentralAir', 'MSSubClass', 'OverallCond',
        'YrSold', 'MoSold']

for c in cols:
    lbl = LabelEncoder()
    lbl.fit(list(full[c].values))
    full[c] = lbl.transform(list(full[c].values))

full[cols].head()
| FireplaceQu | BsmtQual | BsmtCond | GarageQual | GarageCond | ExterQual | ExterCond | HeatingQC | PoolQC | KitchenQual | ... | LandSlope | LotShape | PavedDrive | Street | Alley | CentralAir | MSSubClass | OverallCond | YrSold | MoSold | |
|---|---|---|---|---|---|---|---|---|---|---|---|---|---|---|---|---|---|---|---|---|---|
| 0 | 3 | 2 | 4 | 5 | 5 | 2 | 4 | 0 | 3 | 2 | ... | 0 | 3 | 2 | 1 | 1 | 1 | 10 | 4 | 2 | 4 |
| 1 | 5 | 2 | 4 | 5 | 5 | 3 | 4 | 0 | 3 | 3 | ... | 0 | 3 | 2 | 1 | 1 | 1 | 5 | 7 | 1 | 7 |
| 2 | 5 | 2 | 4 | 5 | 5 | 2 | 4 | 0 | 3 | 2 | ... | 0 | 0 | 2 | 1 | 1 | 1 | 10 | 4 | 2 | 11 |
| 3 | 2 | 4 | 1 | 5 | 5 | 3 | 4 | 2 | 3 | 2 | ... | 0 | 0 | 2 | 1 | 1 | 1 | 11 | 4 | 0 | 4 |
| 4 | 5 | 2 | 4 | 5 | 5 | 2 | 4 | 0 | 3 | 2 | ... | 0 | 0 | 2 | 1 | 1 | 1 | 10 | 4 | 2 | 3 |
5 rows × 26 columns
由于面积相关的特征对房价的决定非常重要,所以可以增加了一个特征,即每栋房子的地下室、一楼和二楼的总面积
full['TotalSF'] = full['TotalBsmtSF'] + full['1stFlrSF'] + full['2ndFlrSF']
full['TotalSF'].head()
0    2566.0
1    2524.0
2    2706.0
3    2473.0
4    3343.0
Name: TotalSF, dtype: float64
特征的偏度
numeric_feats = full.dtypes[full.dtypes != "object"].index

# Check the skew of all numerical features
skewed_feats = full[numeric_feats].apply(lambda x: skew(x.dropna())).sort_values(ascending=False)
print("\nSkew in numerical features: \n")
skewness = pd.DataFrame({'Skew' :skewed_feats})
skewness.head()
Skew in numerical features:
| Skew | |
|---|---|
| MiscVal | 21.939672 |
| PoolArea | 17.688664 |
| LotArea | 13.109495 |
| LowQualFinSF | 12.084539 |
| 3SsnPorch | 11.372080 |
高度倾斜特征的Box Cox变换
Box Cox变换公式如下:
f ( x ) = { ( ( 1 + x ) λ − 1 ) λ λ ≠ 0 ln ( 1 + x ) λ = 0 f(x)=\left\{ \begin{aligned} \frac{((1+x)^ \lambda - 1) }\lambda & & \lambda \neq 0 \\ \ln(1+x) && \lambda = 0 \end{aligned} \right. f(x)=⎩⎪⎨⎪⎧λ((1+x)λ−1)ln(1+x)λ̸=0λ=0
skewness = skewness[abs(skewness) > 0.75]
print("There are {} skewed numerical features to Box Cox transform".format(skewness.shape[0]))

from scipy.special import boxcox1p
skewed_features = skewness.index
lam = 0.15
for feat in skewed_features:
    #all_data[feat] += 1
    full[feat] = boxcox1p(full[feat], lam)
There are 59 skewed numerical features to Box Cox transform
转换为one-hot(独热编码)
full=pd.get_dummies(full)
full.shape
(2917, 220)
数据切分
train=full[:1458]
train.shape
(1458, 220)
test=full[1458:]
test.shape
(1459, 220)
建立模型
回归模型采用的评价标准是 R 2 R^2 R2误差
R 2 = 1 − M S E ( y ^ − y ) v a r ( y ) R^2=1-\frac{MSE(\hat{y}-y)}{var(y)} R2=1−var(y)MSE(y^−y)
其中,MSE为均方误差
from sklearn.linear_model import ElasticNetCV, LassoCV
from sklearn.ensemble import RandomForestRegressor
from sklearn.kernel_ridge import KernelRidge
from sklearn.pipeline import Pipeline
from sklearn.preprocessing import RobustScaler
from sklearn.model_selection import train_test_split,GridSearchCV
from xgboost   import XGBRegressor
from lightgbm  import LGBMRegressor
x1,x2,y1,y2=train_test_split(train,target,random_state=0)
lasso
采用的是sklearn内建的LassoCV进行参数寻优并训练模型
lasso = Pipeline([('scale',RobustScaler()), ('lasso',LassoCV(n_alphas=100,eps=0.00001,cv=6,n_jobs=-1))])#eps相当于alpha_min / alpha_max
lasso.fit(x1,y1)
lasso.score(x2,y2)
0.8741211199435852
弹性网
采用的是sklearn内建的ElasticNetCV进行参数寻优并训练模型
ENet = Pipeline([('scale',RobustScaler()),('ele',ElasticNetCV(l1_ratio=0.95,cv=5,n_jobs=-1,eps=0.00001,normalize=True))])
ENet.fit(x1,y1)
ENet.score(x2,y2)
0.8547090900316762
内核岭回归
param={'alpha':np.arange(0.1,1,10),'kernel':['polynomial','linear','rbf']}
sv=GridSearchCV(KernelRidge(),param,cv=5,n_jobs=-1)
sv.fit(x1,y1)
sv.best_estimator_
KernelRidge(alpha=0.1, coef0=1, degree=3, gamma=None, kernel='polynomial',
            kernel_params=None)
KRR = KernelRidge(alpha=0.1)
KRR.fit(x1,y1)
KRR.score(x2,y2)
0.867680850292428
boosting
采用网格搜索对xgboost、lightgbm分别进行参数寻优,并将最优参数传入模型
param={'n_estimators':[100,200,300,400,500,600,700,800,900,1000],
      ' max_depth':[3,4,5,6,7,8],'learning_rate':[0.01,0.025,0.05,0.75,0.1]}
gb=GridSearchCV(XGBRegressor(),param,cv=5,n_jobs=-1)
gb.fit(x1,y1)
gb.best_estimator_
XGBRegressor( max_depth=3, base_score=0.5, booster='gbtree',
             colsample_bylevel=1, colsample_bynode=1, colsample_bytree=1,
             gamma=0, importance_type='gain', learning_rate=0.05,
             max_delta_step=0, max_depth=3, min_child_weight=1, missing=None,
             n_estimators=1000, n_jobs=1, nthread=None, objective='reg:linear',
             random_state=0, reg_alpha=0, reg_lambda=1, scale_pos_weight=1,
             seed=None, silent=None, subsample=1, verbosity=1)
xgb = XGBRegressor(n_estimators=1000,learning_rate=0.05,n_jobs=-1)
xgb.fit(x1,y1,eval_set=[(x1,y1),(x2,y2)],verbose=None)
xgb.score(x2,y2)
0.9399195242479638
gb1=GridSearchCV(LGBMRegressor(),param,cv=5,n_jobs=-1)
gb1.fit(x1,y1)
gb1.best_estimator_
LGBMRegressor( max_depth=3, boosting_type='gbdt', class_weight=None,
              colsample_bytree=1.0, importance_type='split', learning_rate=0.1,
              max_depth=-1, min_child_samples=20, min_child_weight=0.001,
              min_split_gain=0.0, n_estimators=300, n_jobs=-1, num_leaves=31,
              objective=None, random_state=None, reg_alpha=0.0, reg_lambda=0.0,
              silent=True, subsample=1.0, subsample_for_bin=200000,
              subsample_freq=0)
gb = LGBMRegressor(learning_rate=0.1,n_estimator=300)
gb.fit(x1,y1,eval_set=[(x1,y1),(x2,y2)],verbose=None)
gb.score(x2,y2)
0.923220098276669
RF
使用网格搜索获取随机树的最优个数,并将其传入模型,进行预测
model=GridSearchCV(RandomForestRegressor(),{'n_estimators':[100,200,300,400,500,600,700,800,900,1000]},cv=5,n_jobs=-1)
model.fit(x1,y1)
model.best_estimator_
RandomForestRegressor(bootstrap=True, criterion='mse', max_depth=None,
                      max_features='auto', max_leaf_nodes=None,
                      min_impurity_decrease=0.0, min_impurity_split=None,
                      min_samples_leaf=1, min_samples_split=2,
                      min_weight_fraction_leaf=0.0, n_estimators=600,
                      n_jobs=None, oob_score=False, random_state=None,
                      verbose=0, warm_start=False)
rf=RandomForestRegressor(n_estimators=600)
rf.fit(x1,y1)
rf.score(x2,y2)
0.9256840248024706
stacking
Stacking的主要思想是训练模型来学习使用底层学习器的预测结果,stacking中基模型在所有数据集上生成预测结果,次学习器会基于模型的预测结果进行再训练。
过程是:
1. 首先将所有数据集生成测试集和训练集(假如训练集为10000,测试集为2500行),那么5折stacking会进行5折交叉检验,使用训练集中的8000条作为喂养集,剩余2000行作为验证集
2. 接下来会将验证集的 5 × 2000 5\times 2000 5×2000条预测结果拼接成10000行长的矩阵,标记为A1,而对于 5 × 2500 5\times 2500 5×2500行的测试集的预测结果进行加权平均,得到一个2500一列的矩阵,标记为B1。
3. 上面得到一个基模型在数据集上的预测结果A1、B1,这样当我们对3个基模型进行集成的话,相于得到了A1、A2、A3、B1、B2、B3六个矩阵。
4. 之后我们会将A1、A2、A3并列在一起成10000行3列的矩阵作为training data,B1、B2、B3合并在一起成2500行3列的矩阵作为testing data,让下层学习器基于这样的数据进行再训练
5. 再训练是基于每个基础模型的预测结果作为特征(三个特征),次学习器会学习训练如果往这样的基学习的预测结果上赋予权重w,来使得最后的预测最为准确。
from mlxtend.regressor import StackingRegressor
reg=StackingRegressor([rf,gb,KRR,ENet,lasso],xgb)
reg.fit(train,target)
result=reg.predict(test)
sub = pd.DataFrame()
sub['Id'] = testid
sub['SalePrice'] = result
sub.to_csv('submission.csv',index=False)


