Python绘制用于学术论文投稿的黑白图片
最近这段时间一连投递了好几篇论文,全部都是黑白印刷的期刊,费了一些功夫把原本的彩图改成了黑白的,发现黑白图也没有想象中的那么难看,朴素的别具一格!下面做一个总结吧,考虑到论文数据需要保密,作图使用的数据是由numpy随机生成的。
折线图
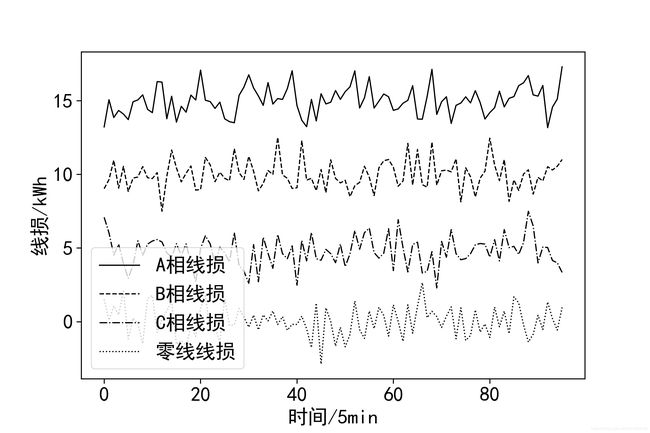
首先是最简单的折线图,每条线的color都是黑色,用linestyle加以区分,linestyle可以选择"-"、"–"、"-."、":"或""。另外,坐标轴刻度、坐标轴名称、标签名称等等字体要调大一些,在figsize = (9, 6)的画布大小下我习惯把fontsize调成20,确保插入论文后字体大小看起来与正文中的小五一样大(当然不同的期刊可能也会有不同要求)。最后使用plt.savefig()保存图片,而不是
直接对IDE展示的图片右键保存(在本人电脑里这么保存的图片清晰度比较低),通过dpi参数调整需要保存图片的分辨率,我习惯设为300。
import pandas as pd
import numpy as np
import matplotlib.pyplot as plt
import seaborn as sns
plt.rcParams['font.sans-serif'] = ['SimHei']
plt.rcParams['axes.unicode_minus'] = False
sns.set_context("paper")

np.random.seed(2020)
loss = pd.DataFrame({'A相线损': np.random.randn(96) + 15, 'B相线损': np.random.randn(96) + 10, 'C相线损': np.random.randn(96) + 5, '零线线损': np.random.randn(96)})

fig, ax = plt.subplots(1, 1, figsize = (9, 6))
ax.plot(loss['A相线损'], color = 'k', label = 'A相线损', linestyle = '-')
ax.plot(loss['B相线损'], color = 'k', label = 'B相线损', linestyle = '--')
ax.plot(loss['C相线损'], color = 'k', label = 'C相线损', linestyle = '-.')
ax.plot(loss['零线线损'], color = 'k', label = '零线线损', linestyle = ':')
ax.set_xlabel('时间/5min', fontsize = 20)
ax.set_ylabel('线损/kWh', fontsize = 20)
ax.tick_params(labelsize = 20)
ax.legend(fontsize = 20)
plt.savefig('图1.jpg', dpi = 300)
plt.show()
并列柱状图
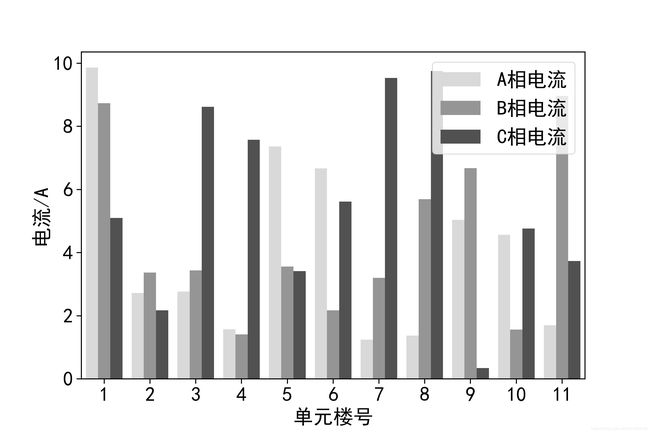
普通的柱状图没什么好说的,来看看并列柱状图。黑白图的关键在于sns.barplot()的参数palette,这里用到的是共有3种颜色的灰色调色板sns.color_palette('Greys', 3)。
import pandas as pd
import numpy as np
import matplotlib.pyplot as plt
import seaborn as sns
plt.rcParams['font.sans-serif'] = ['SimHei']
plt.rcParams['axes.unicode_minus'] = False
sns.set_context("paper")

np.random.seed(2020)
I = pd.DataFrame()
for i in range(1, 12):
    I_tmp = pd.DataFrame(columns = ['单元楼号', '相位', '电流/A'])
    I_tmp['相位'] = ['A相电流', 'B相电流', 'C相电流']
    I_tmp['电流'] = np.random.rand(3) * 10
    I_tmp['单元楼号'] = i
    I = pd.concat([I, I_tmp], axis = 0)

fig, ax = plt.subplots(1, 1, figsize = (9, 6))
sns.barplot(x = '单元楼号', y = '电流', hue = '相位', data = I, palette = sns.color_palette('Greys', 3), ax = ax)
ax.set_xlabel('单元楼号', fontsize = 20)
ax.set_ylabel('电流/A', fontsize = 20)
ax.tick_params(labelsize = 20)
ax.legend(fontsize = 20)
plt.savefig('图2.jpg', dpi = 300)
plt.show()
箱线图
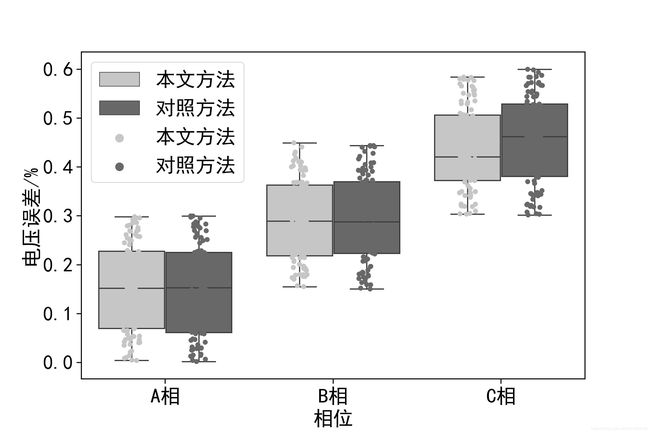
跟上面的并列柱状图差不多,为了做出黑白图同样用到的是palette = sns.color_palette('Greys', 2)。不同的是,并列柱状图中确定的x、y和hue只对应一个数字,而箱线图对应多个数字。
import pandas as pd
import numpy as np
import matplotlib.pyplot as plt
import seaborn as sns
plt.rcParams['font.sans-serif'] = ['SimHei']
plt.rcParams['axes.unicode_minus'] = False
sns.set_context("paper")

np.random.seed(2020)
U_error = pd.DataFrame()
for index, phase in enumerate(['A相', 'B相', 'C相']):
    U_error_tmp = pd.DataFrame(columns = ['相位', '电压误差', '计算方法'])
    U_error_tmp['电压误差'] = np.random.rand(192) * 0.3 + 0.15 * index
    U_error_tmp['相位'] = phase
    U_error_tmp.loc[: 95, '计算方法'] = '本文方法'
    U_error_tmp.loc[96: , '计算方法'] = '对照方法'
    U_error = pd.concat([U_error, U_error_tmp], axis = 0)

fig, ax = plt.subplots(1, 1, figsize = (9, 6))
sns.boxplot(x = '相位', y = '电压误差', hue = '计算方法', data = U_error, palette = sns.color_palette('Greys', 2), ax = ax)
sns.stripplot(x = '相位', y = '电压误差', hue = '计算方法', data = U_error, palette = sns.color_palette('Greys', 2), ax = ax, jitter = True, split = True)
ax.set_xlabel('相位', fontsize = 20)
ax.set_ylabel('电压误差/%', fontsize = 20)
ax.tick_params(labelsize = 20)
ax.legend(fontsize = 20)
plt.savefig('图3.jpg', dpi = 300)
plt.show()
堆积折线图
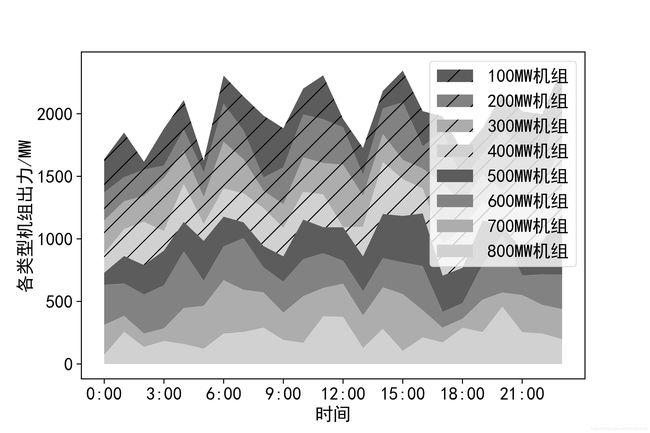
论文中也用到了堆积折线图,因为每两条折线之间的区域都需要通过一个语句填充颜色,没法像上两张图一样用palette = sns.color_palette('Greys', n)来直接填充,但我一次意外发现,用sns.color_palette()[]就能直接指定这个调色板中的每个颜色了。下面的图片需要区分四种颜色,考虑到调色板里的第一个颜色太浅,最后一个颜色太深,我选择了6种颜色的调色板sns.color_palette('Greys', 6),取其中1~4进行单独的颜色填充。
import pandas as pd
import numpy as np
import matplotlib.pyplot as plt
import seaborn as sns
plt.rcParams['font.sans-serif'] = ['SimHei']
plt.rcParams['axes.unicode_minus'] = False
sns.set_context("paper")

np.random.seed(2020)
power = pd.DataFrame(np.random.randn(8, 24))
power = (power - power.min().min()) * 100
power.index = [str(i) + '00MW机组' for i in range(8, 0, -1)]
p_cumsum = np.cumsum(power)

fig, ax = plt.subplots(1, 1, figsize = (9, 6))
ax.fill_between(p_cumsum.columns, p_cumsum.iloc[6], p_cumsum.iloc[7], facecolor = sns.color_palette('Greys', 6)[4], hatch = '/', label = p_cumsum.index[7])
ax.fill_between(p_cumsum.columns, p_cumsum.iloc[5], p_cumsum.iloc[6], facecolor = sns.color_palette('Greys', 6)[3], hatch = '/', label = p_cumsum.index[6])
ax.fill_between(p_cumsum.columns, p_cumsum.iloc[4], p_cumsum.iloc[5], facecolor = sns.color_palette('Greys', 6)[2], hatch = '/', label = p_cumsum.index[5])
ax.fill_between(p_cumsum.columns, p_cumsum.iloc[3], p_cumsum.iloc[4], facecolor = sns.color_palette('Greys', 6)[1], hatch = '/', label = p_cumsum.index[4])
ax.fill_between(p_cumsum.columns, p_cumsum.iloc[2], p_cumsum.iloc[3], facecolor = sns.color_palette('Greys', 6)[4], label = p_cumsum.index[3])
ax.fill_between(p_cumsum.columns, p_cumsum.iloc[1], p_cumsum.iloc[2], facecolor = sns.color_palette('Greys', 6)[3], label = p_cumsum.index[2])
ax.fill_between(p_cumsum.columns, p_cumsum.iloc[0], p_cumsum.iloc[1], facecolor = sns.color_palette('Greys', 6)[2], label = p_cumsum.index[1])
ax.fill_between(p_cumsum.columns, 0, p_cumsum.iloc[0], facecolor = sns.color_palette('Greys', 6)[1], label = p_cumsum.index[0])
ax.set_xlabel('时间', fontsize = 18)
ax.set_ylabel('各类型机组出力/MW', fontsize = 18)
plt.xticks([i for i in range(0, 24, 3)], [str(i) + ':00' for i in range(0, 24, 3)])
ax.tick_params(labelsize = 18)
ax.legend(fontsize = 18)
plt.savefig('图4.jpg', dpi = 300)
plt.show()
除此之外,使用调色板sns.color_palette()的时候,还可以用函数sns.palplot()来展示调色板中的各种颜色。
sns.palplot(sns.color_palette('Greys', 6))

三维曲面图
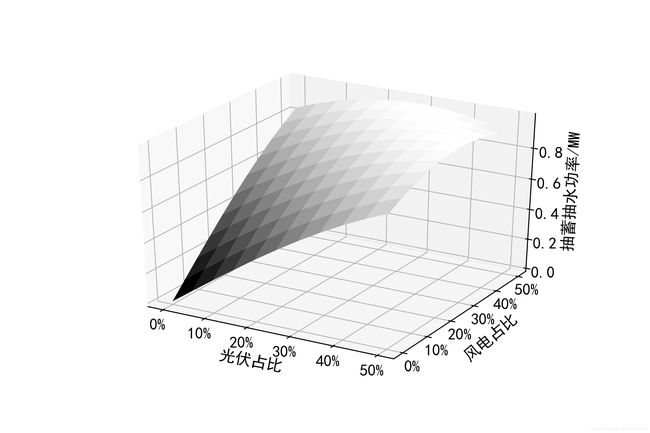
在Python中使用颜色映射colormap,也是能得到黑白三维曲面图的。黑白图的关键在ax.plot_surface()的参数cmap,使用颜色映射plt.cm.gray就能得到黑白的三维曲面图了。
import pandas as pd
import numpy as np
import matplotlib.pyplot as plt
import seaborn as sns
from mpl_toolkits.mplot3d import Axes3D
plt.rcParams['font.sans-serif'] = ['SimHei']
plt.rcParams['axes.unicode_minus'] = False
sns.set_context("paper")

data = pd.DataFrame(index = np.arange(0, 1.05, 0.1), columns = np.arange(0, 1.05, 0.1))
for i in range(data.shape[0]):
    for j in range(data.shape[1]):
        data.iloc[i, j] = np.sin(data.index[i] + data.index[j])
X, Y = np.meshgrid(data.index, data.columns)

fig = plt.figure(figsize = (9, 6))
ax = fig.add_subplot(111, projection='3d')
ax.plot_surface(X, Y, data, rstride = 1, cstride = 1, cmap = plt.cm.gray)
plt.xticks([0, 0.2, 0.4, 0.6, 0.8, 1], ['0%', '10%', '20%', '30%', '40%', '50%'])
plt.yticks([0, 0.2, 0.4, 0.6, 0.8, 1], ['0%', '10%', '20%', '30%', '40%', '50%'])
ax.tick_params(labelsize = 16, pad = 0, axis = 'x')
ax.tick_params(labelsize = 16, pad = 0, axis = 'y')
ax.tick_params(labelsize = 16, pad = 2, axis = 'z')
ax.set_xlabel('光伏占比', fontsize = 16, rotation = -11, labelpad = 4)
ax.set_ylabel('风电占比', fontsize = 16, rotation = 40)
ax.set_zlabel('抽蓄抽水功率/MW', fontsize = 16, labelpad = 2)
plt.savefig('图6.jpg', dpi = 300)
plt.show()
