《R的极客理想—工具篇》—— 2.3 时间序列可视化plot.xts
本节书摘来自华章出版社《R的极客理想—工具篇》一 书中的第2章,第2.2节,作者:张丹,更多章节内容可以访问云栖社区“华章计算机”公众号查看。
2.3 时间序列可视化plot.xts
引言
r-bloggers的一篇博文:plot.xts is wonderful!,让我有动力继续发现xts的强大。xts扩展了zoo的基础数据结构,并提供了更丰富的功能函数。xtsExtra补充库从可视化的角度出发,提供了一个简单而效果非凡的作图函数plot.xts。本节将用plot.xts来演示xts对象的时间序列可视化!
2.3.1 xtsExtra介绍
xtsExtra是xts包的功能补充包,该软件包在Google Summer of Code 2012发布,最终将合并到xts包,不过在笔者写这本书的时候还没有合并。xtsExtra提供的主要功能就是plot.xts()函数。xts::plot.xts()函数与xtsExtra::plot.xts()函数还是有差别的,下面我们就详细介绍其中的差别!
2.3.2 xtsExtra安装
本节使用的系统环境是:
Win7 64bit
R: 3.0.1 x86_64-w64-mingw32/x64 b4bit
注 xtsExtra同时支持Windows 7环境和Linux环境。
由于xtsExtra没有发布到CRAN,我们要从R-Forge下载。
~ R  # 启动R程序
> install.packages("xtsExtra", repos="http://R-Forge.R-project.org")
# 从R-Forge下载xtsExtra包
> library(xtsExtra)  # 加载xtsExtra包
xtsExtra::plot.xts()函数覆盖了xts::plot.xts()函数。
2.3.3 xtsExtra包的使用
plot.xts()函数的参数列表如下:
> names(formals(plot.xts))
 [1]    "x"    "y"    "screens"    "layout.screens"    "..."
 [6]    "yax.loc"    "auto.grid"    "major.ticks"    "minor.ticks"    "major.format"
[11]    "bar.col.up"    "bar.col.dn"    "candle.col"    "xy.labels"    "xy.lines"
[16]    "ylim"    "panel"    "auto.legend"    "legend.names"    "legend.loc"
[21]    "legend.pars"    "events"    "blocks"    "nc"    "nr"
> data(sample_matrix)
> sample_xts <- as.xts(sample_matrix)
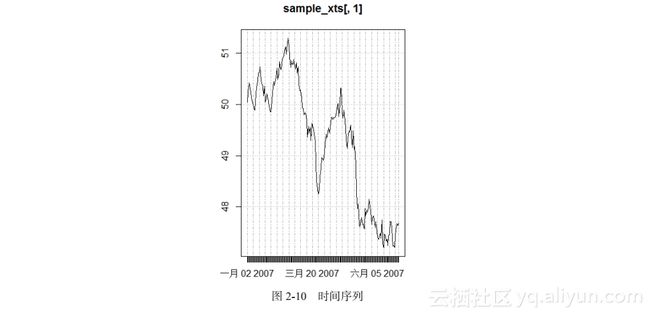
> plot(sample_xts[,1])
> class(sample_xts[,1])
[1] "xts" "zoo"
从图2-10似乎看不出xtsExtra::plot.xts()函数与xts::plot.xts()函数的不同效果。接下来,我们画点稍微复杂的图形。
- 画K线图
下面就来画K线图,默认红白配色,如图2-11所示。
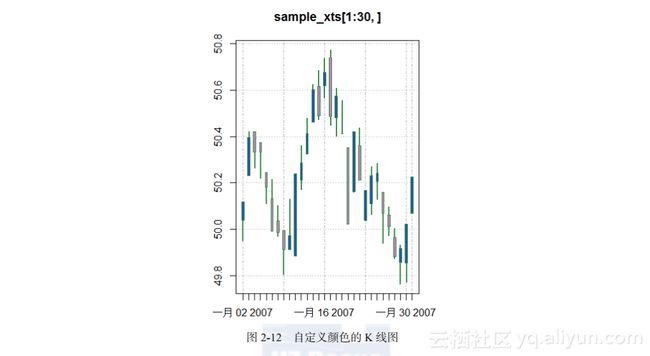
> plot(sample_xts[1:30, ], type = "candles")画K线图:自定义颜色,如图2-12所示。
> plot(sample_xts[1:30, ], type = "candles", bar.col.up = "blue", bar.col.dn =
"violet", candle.col = "green4")- 对panel配置
画基本面板,如图2-13所示。
> plot(sample_xts[,1:2])
画多行面板,如图2-14所示。
> plot(sample_xts[,rep(1:4, each = 3)])画自由组合面板,如图2-15所示。
> plot(sample_xts[,1:4], layout.screens = matrix(c(1,1,1,1,2,3,4,4),ncol = 2,
 byrow = TRUE))
通过画K线图和面板,就能发现plot.xts()函数提供很多种的画图参数设置,让我们画时间序列图可以有更丰富的可视化表示表现形式。
- 对screens配置
画双屏幕显示,每屏幕2条线,如图2-16所示。
> plot(sample_xts, screens = 1:2)画双屏幕显示,指定曲线出现的屏幕和颜色,如图2-17所示。
> plot(sample_xts, screens = c(1,2,1,2), col = c(1,3,2,2))画双屏幕显示,指定不同的坐标系,如图2-18所示。
> plot(10^sample_xts, screens = 1:2, log= c("","y"))画双屏幕显示,指定不同的输出图形,如图2-19所示。
> plot(sample_xts[1:75,1:2] - 50.5, type = c("l","h"), lwd = c(1,2))画多屏幕,并分组显示,如图2-20所示。
> plot(sample_xts[,c(1:4, 3:4)], layout = matrix(c(1,1,1,1,2,2,3,4,5,6), ncol = 2,
byrow = TRUE), yax.loc = "left")- 对events配置
画基本事件分割线,如图2-21所示。
> plot(sample_xts[,1], events = list(time = c("2007-03-15","2007-05-01"), label
  = "bad days"), blocks = list(start.time = c("2007-03-05", "2007-04-15"), end.
time = c("2007-03-20","2007-05-30"), col = c("lightblue1", "lightgreen")))- 双坐标的时间序列
画双坐标视图,如图2-22所示。
> plot(sample_xts[,1],sample_xts[,2])画双坐标梯度视图,如图2-23所示。
> cr <- colorRampPalette(c("#00FF00","#FF0000"))
> plot(sample_xts[,1],sample_xts[,2], xy.labels = FALSE, xy.lines = TRUE, col =
cr(NROW(sample_xts)), type = "l")- 对xts类型转换作图
以ts数据类型作图,如图2-24所示。
> tser <- ts(cumsum(rnorm(50, 0.05, 0.15)), start = 2007, frequency = 12)
> class(tser)
[1] "ts"
> plot(tser)
以xts类型作图,自动增加了背景坐标线,如图2-25所示。
> plot.xts(tser)- 用barplot作图
barplot()函数作条形图,如图2-26所示。
> x <- xts(matrix(abs(rnorm(72)), ncol = 6), Sys.Date() + 1:12)
> colnames(x) <- LETTERS[1:6]
> barplot(x)
我们看到xtsExtra::plot.xts()函数提供了强大的作图功能,很容易做出包含丰富元素的时间序列!


