Filebeat的入门安装使用
日志采集的工具有很多种,如logagent, flume, logstash,betas等等。首先要知道为什么要使用filebeat呢?因为logstash是jvm跑的,资源消耗比较大,启动一个logstash就需要消耗500M左右的内存,而filebeat只需要10来M内存资源。常用的ELK日志采集方案中,大部分的做法就是将所有节点的日志内容通过filebeat送到kafka消息队列,然后使用logstash集群读取消息队列内容,根据配置文件进行过滤。然后将过滤之后的文件输送到elasticsearch中,通过kibana去展示。
1.下载安装包
https://www.elastic.co/cn/downloads/beats/filebeat
2.安装
解压:tar -zxvf filebeat-5.5.2-linux-x86_64.tar.gz
创建软链接:ln -s filebeat-5.5.2-linux-x86_64 filebeat
3.配置文件(同时输出到es和logstash以及kafka)
vi filebeat.yml
filebeat.prospectors:
- input_type: log
  paths:
    - /home/pgxl/elk/a.txt

# ----------------output.elasticsearch-------------------------
output.elasticsearch:
  hosts: ["localhost:9200"]
  protocol: "http"
  index: "stat_filebeat"
 # template.name: "stat_ilebeat"
 # template.path: "filebeat.template.json"
 # template.overwrite: false

#----------------output.logstash-----------------------------
output.logstash:
  hosts: ["localhost:5044"]

#---------------output.kafka----------------------------------
output.kafka:
  enabled: true
  hosts: ["192.168.10.1:9092","192.168.10.2:9092","192.168.10.3:9092"]
  topic: "liuzc_test"
  partition.round_robin:
    reachable_only: true
  worker: 2
  required_acks: 1
  compression: gzip
  max_message_bytes: 10000000
4.启动filebeat
./filebeat -e -c filebeat.yml
5.logstash监听filebeat的配置文件(只是输出监听到的数据到控制台,不写入别的组件)
input {
  beats {
    port => 5044
  }
}
output {
    stdout{codec=>"rubydebug"}
}
6.kibana查看结果
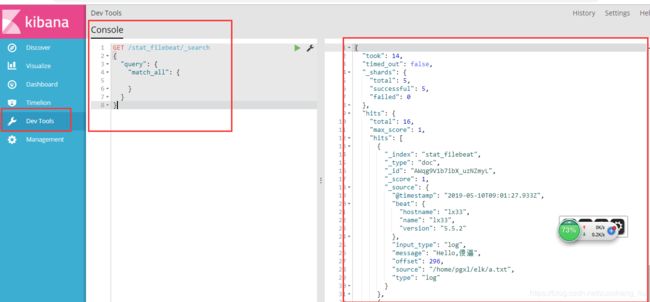
7.遇到的坑
用上述配置文件启动logstash的时候居然报错
The error reported is:
Couldn't find any input plugin named 'beats'. Are you sure this is correct? Trying to load the beats input plugin resulted in this error: no such file to load -- logstash/inputs/beats

大概意思就说说缺少logstash-input-beats这个组件,然后就查看一下安装的组件有哪些:
[pgxl@lx33 logstash]$ bin/plugin list
logstash-codec-collectd
logstash-codec-dots
logstash-codec-edn
logstash-codec-edn_lines
logstash-codec-es_bulk
logstash-codec-fluent
logstash-codec-graphite
logstash-codec-json
logstash-codec-json_lines
logstash-codec-line
logstash-codec-msgpack
logstash-codec-multiline
logstash-codec-netflow
logstash-codec-oldlogstashjson
logstash-codec-plain
logstash-codec-rubydebug
logstash-filter-anonymize
logstash-filter-checksum
logstash-filter-clone
logstash-filter-csv
logstash-filter-date
logstash-filter-dns
logstash-filter-drop
logstash-filter-fingerprint
logstash-filter-geoip
logstash-filter-greenline
logstash-filter-grok
logstash-filter-json
logstash-filter-kv
logstash-filter-metrics
logstash-filter-multiline
logstash-filter-mutate
logstash-filter-ruby
logstash-filter-sleep
logstash-filter-split
logstash-filter-syslog_pri
logstash-filter-throttle
logstash-filter-urldecode
logstash-filter-useragent
logstash-filter-uuid
logstash-filter-xml
logstash-input-couchdb_changes
logstash-input-elasticsearch
logstash-input-eventlog
logstash-input-exec
logstash-input-file
logstash-input-ganglia
logstash-input-gelf
logstash-input-generator
logstash-input-graphite
logstash-input-heartbeat
logstash-input-http
logstash-input-imap
logstash-input-irc
logstash-input-kafka
logstash-input-log4j
logstash-input-lumberjack
logstash-input-pipe
logstash-input-rabbitmq
logstash-input-redis
logstash-input-s3
logstash-input-snmptrap
logstash-input-sqs
logstash-input-stdin
logstash-input-syslog
logstash-input-tcp
logstash-input-twitter
logstash-input-udp
logstash-input-unix
logstash-input-xmpp
logstash-input-zeromq
logstash-output-cloudwatch
logstash-output-csv
logstash-output-elasticsearch
logstash-output-elasticsearch_http
logstash-output-email
logstash-output-exec
logstash-output-file
logstash-output-ganglia
logstash-output-gelf
logstash-output-graphite
logstash-output-hipchat
logstash-output-http
logstash-output-irc
logstash-output-juggernaut
logstash-output-kafka
logstash-output-lumberjack
logstash-output-nagios
logstash-output-nagios_nsca
logstash-output-null
logstash-output-opentsdb
logstash-output-pagerduty
logstash-output-pipe
logstash-output-rabbitmq
logstash-output-redis
logstash-output-s3
logstash-output-sns
logstash-output-sqs
logstash-output-statsd
logstash-output-stdout
logstash-output-tcp
logstash-output-udp
logstash-output-xmpp
logstash-output-zeromq
logstash-patterns-core
发现果然没有logstash-input-beats,那么就我们自己来安装一下吧
bin/plugin install logstash-input-beats
Validating logstash-input-beats
Unable to download data from https://rubygems.org/ - Received fatal alert: protocol_version (https://api.rubygems.org/latest_specs.4.8.gz)
ERROR: Installation aborted, verification failed for logstash-input-beats
报验证不通过,那么我们就不让它验证好了,加一个(-no-verify)参数吧
bin/plugin install --no-verify logstash-input-beats
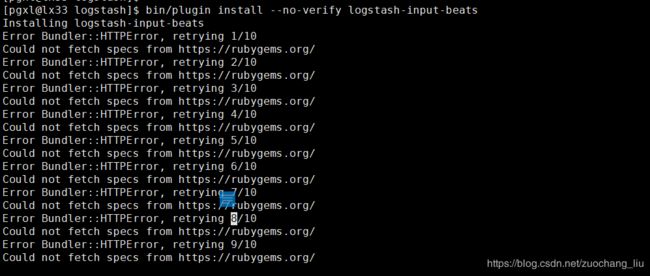
然而我们还是会发现,安装不成功,到此为止,我也不知道怎么解决这个问题,因为我们线上logstash 的版本是1.5.3的,所以我感觉可能是版本太低导致的,接着就下载了一个稍微高点的版本的2.3.0的logstash,同样的配置文件,结果发现启动没有任何问题
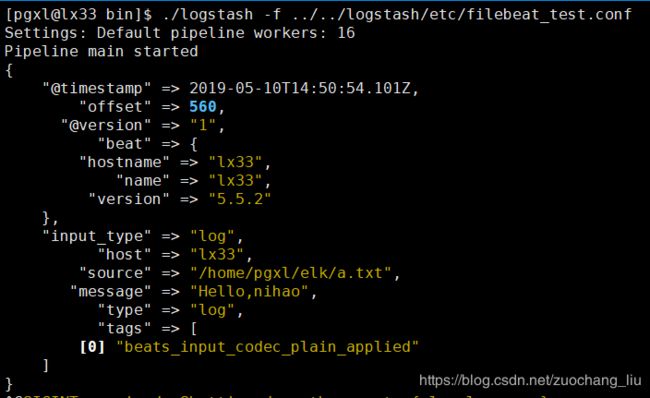
结果:
监听到的filebeat写到logstash的数据能正常采集到,流程验证ok
======================================================================
以后博客的内容都是通过微信公众号链接的形式发布,之后迁移到公众号的文章都会重新修正,也更加详细,对于以前博客内容里面的错误或者理解不当的地方都会在公众号里面修正。
欢迎关注我的微信公众号,以后我会发布更多工作中总结的技术内容。