Apache ab压力测试
Windows安装Apache
下载Apache 2.4.39
官网:https://httpd.apache.org

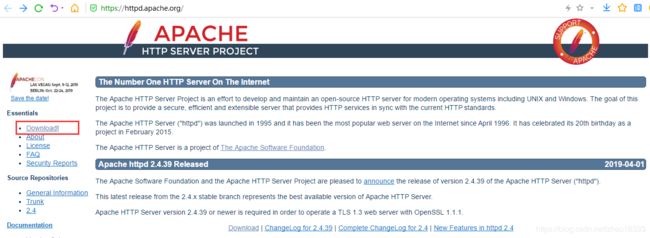
单击Download,打开了下图。

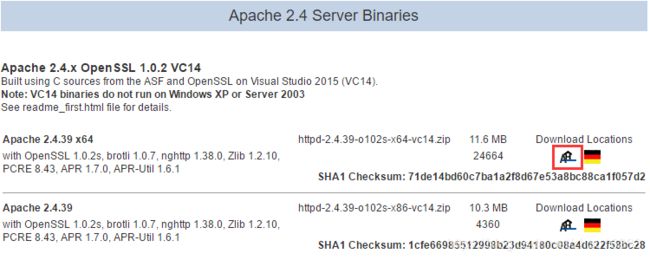
单击a number of third party vendors,得到下图。

选择第一个,打开后,网址为 https://www.apachehaus.com/cgi-bin/download.plx#APACHE24VC14
根据目前系统,选择x64。

下载网址为:https://www.apachehaus.com/downloads/httpd-2.4.39-o102s-x64-vc14.zip
解压
下载后,解压目录为 E:\Program Files\Apache24
配置
修改配置文件 E:\Program Files\Apache24\conf\httpd.conf
a. 38行,注意路径中的空格需要转义。
#
# ServerRoot: The top of the directory tree under which the server's
# configuration, error, and log files are kept.
#
# Do not add a slash at the end of the directory path.  If you point
# ServerRoot at a non-local disk, be sure to specify a local disk on the
# Mutex directive, if file-based mutexes are used.  If you wish to share the
# same ServerRoot for multiple httpd daemons, you will need to change at
# least PidFile.
#

Define SRVROOT "E:\Program\ Files\Apache24"
ServerRoot "${SRVROOT}"
b. 60行
# Listen: Allows you to bind Apache to specific IP addresses and/or
# ports, instead of the default. See also the
# directive.
#
# Change this to Listen on specific IP addresses as shown below to
# prevent Apache from glomming onto all bound IP addresses.
#
#Listen 12.34.56.78:80
Listen 8088
c. 225行
#
# ServerName gives the name and port that the server uses to identify itself.
# This can often be determined automatically, but we recommend you specify
# it explicitly to prevent problems during startup.
#
# If your host doesn't have a registered DNS name, enter its IP address here.
#
ServerName localhost:8088
添加系统路径
将E:\Program Files\Apache24\bin添加至系统路径。
CentOS 7安装Apache
yum -y install httpd-tools
参数说明
Usage: ab [options] [http://]hostname[:port]/path
Options are:
    -n requests     Number of requests to perform
    -c concurrency  Number of multiple requests to make at a time
    -t timelimit    Seconds to max. to spend on benchmarking
                    This implies -n 50000
    -s timeout      Seconds to max. wait for each response
                    Default is 30 seconds
    -b windowsize   Size of TCP send/receive buffer, in bytes
    -B address      Address to bind to when making outgoing connections
    -p postfile     File containing data to POST. Remember also to set -T
    -u putfile      File containing data to PUT. Remember also to set -T
    -T content-type Content-type header to use for POST/PUT data, eg.
                    'application/x-www-form-urlencoded'
                    Default is 'text/plain'
    -v verbosity    How much troubleshooting info to print
    -w              Print out results in HTML tables
    -i              Use HEAD instead of GET
    -x attributes   String to insert as table attributes
    -y attributes   String to insert as tr attributes
    -z attributes   String to insert as td or th attributes
    -C attribute    Add cookie, eg. 'Apache=1234; Client=computer'. (repeatable)
    -H attribute    Add Arbitrary header line, eg. 'Accept-Encoding: gzip'
                    Inserted after all normal header lines. (repeatable)
    -A attribute    Add Basic WWW Authentication, the attributes
                    are a colon separated username and password.
    -P attribute    Add Basic Proxy Authentication, the attributes
                    are a colon separated username and password.
    -X proxy:port   Proxyserver and port number to use
    -V              Print version number and exit
    -k              Use HTTP KeepAlive feature
    -d              Do not show percentiles served table.
    -S              Do not show confidence estimators and warnings.
    -q              Do not show progress when doing more than 150 requests
    -l              Accept variable document length (use this for dynamic pages)
    -g filename     Output collected data to gnuplot format file.
    -e filename     Output CSV file with percentages served
    -r              Don't exit on socket receive errors.
    -m method       Method name
    -h              Display usage information (this message)
示例
无参
ab -n 800 -c 800 http://192.168.0.10/
(-n发出800个请求,-c模拟800并发,相当800人同时访问,后面是测试url)
ab -t 60 -c 100 http://192.168.0.10/
在60秒内发请求,一次100个请求。
GET传参
get传参,URL前后必须加双引号,否则 & 符号后面的参数不能被提交。
ab -n 1 -c 1 "http://sy7.net/tests/index.php?name=张三&age=130"
POST参数
ab -n 1 -c 1 -T application/x-www-form-urlencoded -p p.txt http://sy7.net/tests/index.php
p.txt 是和ab.exe在一个目录
p.txt 中可以写参数,如 name=张三&age=120
POST raw
ab -n 1 -c 1 -T application/json -p p.txt http://sy7.net/tests/index.php
ab -n 1 -c 1 -T application/text -p p.txt http://sy7.net/tests/index.php
p.txt内容为:
{
	"name":"张三",
	"age":100
}
携带cookie
-C “Apache=1234; Client=5678”
ab -n 1 -c 1 -C "Apache=1234; Client=5678" http://sy7.net/tests/index.php
命令执行后的输出信息:
ab -n 800 -c 800 http://sy7.net/phpinfo.php

This is ApacheBench, Version 2.3 <$Revision: 655654 $>
Copyright 1996 Adam Twiss, Zeus Technology Ltd, http://www.zeustech.net/
Licensed to The Apache Software Foundation, http://www.apache.org/

Benchmarking 192.168.0.10 (be patient)
Completed 100 requests
Completed 200 requests
Completed 300 requests
Completed 400 requests
Completed 500 requests
Completed 600 requests
Completed 700 requests
Completed 800 requests
Finished 800 requests


Server Software:        Microsoft-HTTPAPI/2.0
Server Hostname:        sy7.net
Server Port:            80

Document Path:          /phpinfo.php
Document Length:        315 bytes       HTTP响应数据的正文长度

Concurrency Level:      800             并发数多少,等于-c后面的数值
Time taken for tests:   0.914 seconds   测试总耗时。所有这些请求处理完成所花费的时间
Complete requests:      800             完成请求数
Failed requests:        0               失败请求数
Write errors:           0
Non-2xx responses:      800              表示返回的HTTP status code不是2xx的数目,,如果都是2xx,这个指标不显示在结果里面。
Total transferred:      393600 bytes     网络总传输量
HTML transferred:       252000 bytes     HTML内容传输量
Requests per second:    875.22 [#/sec] (mean) 吞吐量-每秒请求数
Time per request:       914.052 [ms] (mean)   服务器收到请求,响应页面要花费的时间
Time per request:       1.143 [ms] (mean, across all concurrent requests) 并发的每个请求平均消耗时间
Transfer rate:          420.52 [Kbytes/sec] received 平均每秒网络上的流量,可以帮助排除是否存在网络流量过大导致响应时间延长的问题


网络上消耗的时间的分解:
Connection Times (ms)
              min  mean[+/-sd] median   max
Connect:        0    1   0.5      1       3
Processing:   245  534 125.2    570     682
Waiting:       11  386 189.1    409     669
Total:        246  535 125.0    571     684

整个场景中所有请求的响应情况。在场景中每个请求都有一个响应时间
其中 50% 的用户响应时间小于 571 毫秒
80 % 的用户响应时间小于 652 毫秒
最大的响应时间小于 684 毫秒
Percentage of the requests served within a certain time (ms)
  50%    571
  66%    627
  75%    646
  80%    652
  90%    666
  95%    677
  98%    681
  99%    682
100%    684 (longest request)
参考
[1] [EB/OL] https://www.cnblogs.com/crazycoderl/p/7799216.html
[2] [EB/OL] https://www.cnblogs.com/lishuyi/p/5808661.html
[3] [EB/OL] https://www.baidu.com/link?url=wwqkytMdJNEwonSrJqdxbnbLJAULno310OwSnm7xC_wwTa0dMdOOd5r72ghaQgHHsUobwxg_H7I0pFr-DxZ89q&wd=&eqid=8e829678001c63cc000000055d2a2fb5
[4] [EB/OL] https://www.jianshu.com/p/e3793ae91a62
[5] 官方文档 [EB/OL]. http://httpd.apache.org/docs/2.2/programs/ab.html