一、matplotlib绘图模式
matplotlib的图形绘制是面向对象封装,matplotlib是由多个Figure对象构成,每个Figure对象包含多个子图对象Axes(Axes中还默认包含两个Axis对象,一个表示x轴,一个表示y轴),在Axes中包含多个Artist对象(Artist类实现了很多子类,每个子类对应常规的几何图形绘制与图像绘制等。)
%config InlineBackend.figure_format='svg'
%matplotlib inline
#coding=utf-8
import matplotlib.pyplot as plt
#===========一、创建各种matplotlib对象
#创建一个Figure对象
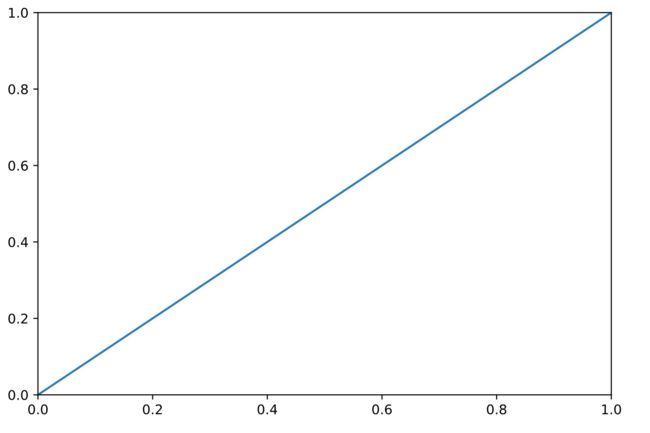
fig=plt.figure()

#创建一个子图Axes对象
axes1=plt.axes((0,0,0.3,0.3))

#创建一个Artist对象
line=plt.Line2D([0,1],[0,1])

#===========二、依次安装容器的包含关系添加子对象到容器
#添加Artist对象到子图Axes
l=axes1.add_artist(line)

#添加子图Axes对象到Figure对象
fig.add_axes(axes1)

#===========三、显示Figure对象
#显示Figure对象
fig.show(warn=False)
#显示当前所有Figure对象(与fig.show()可以选择使用一个)
#plt.show()
上面使用了一个ipython notebook的魔法指令:
(1)用来配置ipython把matplotlib的图像输出为svg矢量图:
|-:%config InlineBackend.figure_format='svg'
(2)把matplotlib的图像输出显示在ipython的cell单元中:
|-:%matplotlib inline
在建立matplotlib整体绘图结构后,我们下面一个个认识其中的Figure,Axes,Axis与Artist对象,从而达到对matplotlib精通掌握的程度。
在matplotlib的操作中,还包含一种更加便捷的编程模式:Figure,Axes,Axis,Artist等对象有的功能函数,有的也在matplotlib.pyplot中提供全局功能函数(这种编程模式在numpy等模块中也大量使用,其目的就是方便,使用者可以根据个人喜爱选择使用)。
二、Figure对象
Figure对象本身也是Artist子类,继承结构如下:
|-class Figure(Artist):
|-class Artist(object):
1. 创建Figure对象的方式
Figure对象一般不需要直接使用构造器构建,应为Figure对象需要纳入管理才行,如果自己创建,会提示不是当前Figure对象;在matplotlib中有一个专门管理Figure的接口,就是Gcf,该类提供了一些Figure对象管理函数。Gcf管理Figure管理器,Figure管理器管理Figure。结构如下:
Gcf
|-FigureManager
|-Figure
上面的对象都可以通过plt全局函数获取
#下面是matplotlib源代码。说明了Figure的创建就两种方式:使用FigureManager,要么使用plt的figure函数。
#当然可以直接调用gcf页可以。
def gcf():
    """Get a reference to the current figure."""
    figManager = _pylab_helpers.Gcf.get_active()
    if figManager is not None:
        return figManager.canvas.figure
    else:
        return figure()
获取Figure管理器,可以直接使用plt的函数get_current_fig_manager,下面是例子代码:
manager=plt.get_current_fig_manager()
print(manager)
1.1. 使用plt的figure函数创建(常用)
#coding=utf-8
import matplotlib.pyplot as plt
'''
使用plt.figure函数创建
'''
#=================================
fig=plt.figure()
#=================================
#创建一个子图Axes对象
axes1=plt.axes((0,0,1,1))
#创建一个Artist对象
line=plt.Line2D([0,1],[0,1])

#添加Artist对象到子图Axes
l=axes1.add_artist(line)
#添加子图Axes对象到Figure对象
fig.add_axes(axes1)
#显示Figure对象
fig.show(warn=False)
1.2. 使用figureManager返回
#coding=utf-8
import matplotlib.pyplot as plt
'''
使用FigureManager获取Figure
'''
#获取FigureManager
manager=plt.get_current_fig_manager()
#获取Figure对象
fig=manager.canvas.figure

#创建一个子图Axes对象
axes1=plt.axes((0,0,1,1))
#创建一个Artist对象
line=plt.Line2D([0,1],[0,1])

#添加Artist对象到子图Axes
l=axes1.add_artist(line)
#添加子图Axes对象到Figure对象
fig.add_axes(axes1)
#显示Figure对象
fig.show(warn=False)
1.3. 使用plt的gcf创建
#coding=utf-8
import matplotlib.pyplot as plt
'''
使用plt.gcf函数得到当前激活的Figure对象。
'''
#返回一个激活的Figure对象(全部采用默认参数)
fig=plt.gcf()

#创建一个子图Axes对象
axes1=plt.axes((0,0,1,1))
#创建一个Artist对象
line=plt.Line2D([0,1],[0,1])

#添加Artist对象到子图Axes
l=axes1.add_artist(line)
#添加子图Axes对象到Figure对象
fig.add_axes(axes1)
#显示Figure对象
fig.show(warn=False)
1.4. 定制Figure
import matplotlib.pyplot as plt
from matplotlib.figure import Figure
class MyFigure(Figure):
    def __init__(self, *args, figtitle='Figure', **kwargs):
        super().__init__(*args, **kwargs)
        self.text(0.5, 0.95, figtitle, ha='center')

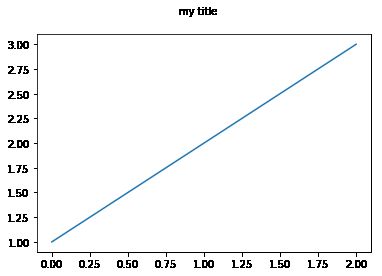
fig = plt.figure(FigureClass=MyFigure, figtitle='my title')
ax = fig.subplots()
ax.plot([1, 2, 3])

fig.show(warn=False)
2. Figure构造器的参数
2.1. Figure构造器参数说明
class matplotlib.figure.Figure(
figsize=None, #Figure的大小,单位是英寸
dpi=None, #分辨率(每英寸的点数)
facecolor=None, #修饰的颜色
edgecolor=None, #边界颜色
linewidth=0.0, #线条宽度
frameon=None, #布尔值,是否绘制框架(Frame)
subplotpars=None, #子图的参数
tight_layout=None, #取值布尔或者字典,缺省自动布局,False 使用subplotpars参数,True就使用tight_layout,如果是字典,则包含如下字段:pad,w_pad,h_pad, 与rect
constrained_layout=None) #True就使用constrained_layout,会自动调整plot的位置。
2.2. Figure构造器参数的默认值
在matplotlib中,提供大量的缺省参数来控制图形的绘制。这些缺省的参数,在matplotlib中使用与一个字典维护,可以通过访问这个字典了解这些参数的取值类型,以及参数的缺省值。
该字典参数有多种配置方式:
|-(1)matplotlib.rcParams
|-(2)当前工作路径下提供一个配置文件配置:matplotlibrc
|-(3)$MATPLOTLIBRC(如果是目录就是目录下的文件) 或者 $MATPLOTLIBRC/matplotlibrc
|-(4).config/matplotlib/matplotlibrc配置文件配置
|-(5)INSTALL/matplotlib/mpl-data/matplotlibrc
可以使用下面python程序访问matplotlib配置文件路径(可以访问到这个文件打开详细浏览下):
import matplotlib as mpl
#获取配置目录
print(mpl.get_configdir())
#配置文件
print(mpl.matplotlib_fname())
/Users/yangqiang/.matplotlib
/Library/Frameworks/Python.framework/Versions/3.6/lib/python3.6/site-packages/matplotlib/mpl-data/matplotlibrc
下面是使用Python语句动态配置或者访问:
#coding=utf-8
import matplotlib.pyplot as plt
import matplotlib
'''
matplotlib.rcParams
'''
#print(matplotlib.rcParams.keys())
print(matplotlib.rcParams['figure.figsize'])
print(matplotlib.rcParams['figure.dpi'])
print(matplotlib.rcParams["figure.facecolor"])
print(matplotlib.rcParams["figure.edgecolor"])
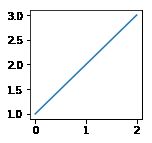
matplotlib.rcParams['figure.figsize']=[2,2]

fig=plt.figure()
ax = fig.subplots()
ax.plot([1, 2, 3])
plt.show()
[12.0, 8.0]
72.0
(1, 1, 1, 0)
(1, 1, 1, 0)
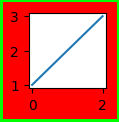
当然,我们更加使用直接在构造器中传递参数,来控制Figure的参数。
#coding=utf-8
import matplotlib.pyplot as plt
import matplotlib
'''
matplotlib.rcParams
'''
fig=plt.figure(figsize=(1,1),dpi=100,facecolor=(1,0,0,1),edgecolor=(0,1,0,1),linewidth=3 )
ax = fig.subplots()
ax.plot([1, 2, 3])
plt.show()
Figure的属性与函数,目前没有时间写,留到下个主题来说明,后面系列主题介绍:Axes对象,Axis对象与Artist对象,以及一些常见图形可视化编程技巧。
三、资源
1. 本文使用的代码,使用ipython notebook提供,同时也提供python代码清单:
|-plt01_config.py
|-plt01_CustomFigure.py
|-plt01_Figure.py
|-plt01_intro.py
|-plt01_param_rc.py
2. 下载地址:https://github.com/QiangAI/AICode/tree/master/matplot

